
How To Know Bank Nifty Trend is a Great Question to Ask! Come let’s Understand How To Predict Bank Nifty Trend.
Trend is not what we just see by our eyes. Trend is a great options trading strategy.
Sometimes trends can be tricky. Especially Bank Nifty trend can be trickier.
Don’t confuse yourself and trade without good trend analysis, else trading will be gambling.
To understand how to know bank nifty trend, you ought to know these details below.
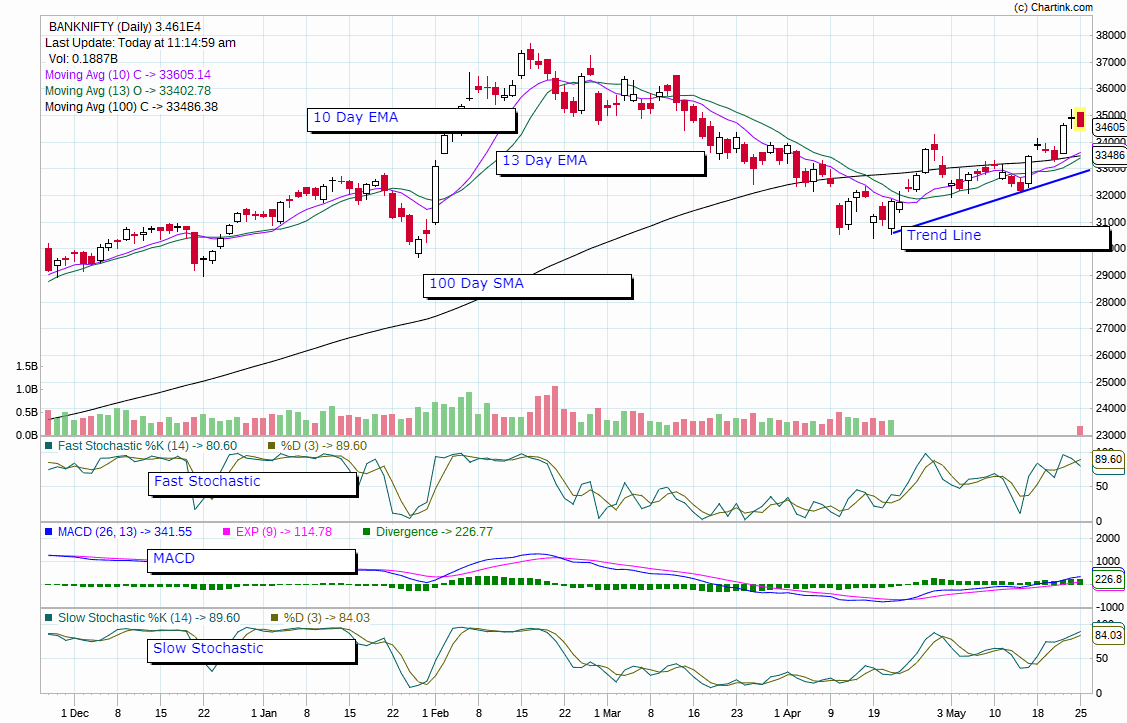
- EMAs
- SMA
- Trend Line
- Fast Stochastic (Optional)
- Slow Stochastic (Optional)
- MACD
Let’s jump and now answer the question of how to know bank nifty trend.
Here I’ve shown what determines how to predict bank nifty trend.
These 6 technical indicators will help you to chalk a strategy to trade bank nifty in the right trend and make it your full time job trading.
1) Exponential Moving Average (EMA):
EMAs are a great way how to predict bank nifty trend.
Why because EMAs are leading indicators and hence give a very clear knowledge of how the trend seems to move.
What are the EMAs consider Tu to determine, how to know Bank Nifty Trend?
We use 10 day a EMAs and 13 day Close EMAs.
2) Simple Moving Average (SMA):
With respect to SMA, we consider it as a support level for a resistance level.
SMA main is a lagging indicator and hence cannot determine the actual Trend that can act as a support.
So we will use SMS to determine the trend by determining the support levels in Bank Nifty.
3) Trend Lines:
Trend lines are a very good indicator of of how the trend is moving at this point of time.
An uptrend line is drawn by joining the lows of the candles without having multiple candles moving below the trend line.
A downtrend line is drawn by joining the highest of the declining lower highs in a downtrending chart. Remember there should not be multiple candles moving above the trendline which we draw.
4) Fast Stochastic (Optional to know):
Fast stochastic is an indicator which determine, if the market is overbought or oversold.
When the fast stockastic indicator, goes above 90, it means that the market is in a over sold zone, which will determine the markets movement on the downside.
When the fast stochastic indicator, was below 10, Bank Nifty is in oversold zone. This means that the Bank Nifty will move in an uptrending direction, by reversing its current downtrend.
5) Slow Stochastic (optional to know):
Slow stochastic also determines if the Bank Nifty e is in overbought or UN oversold zone.
Slow stochastic compared to fast stochastic, is a lagging indicator.
When the slow stockastic indicator, goes above 90, it means that the market is in a over sold zone, which will determine the markets movement on the downside.
When the slow stochastic indicator, was below 10, Bank Nifty is in oversold zone. This means that the Bank Nifty will move in an uptrending direction, by reversing its current downtrend.
6) Moving average convergence divergence (MACD):
MACD is an indicator that determines if the market it has a Momentum to go up or down.
Momentum is the the strength of the market to either go upwards or downwards.
Usually when the MACD is higher then the the signal it shows strength in the market. Hence it means the market may go upwards.
When the MACD the air is lower than the signal, it shows that the strength in the market is weak. Hence it means the market may go downwards.
How To Know Bank Nifty Trend :-
1) EMAs:
When the 10 day EMA is higher than 13 day EMA we seem to have an uptrend.
When the 10 day EMA is lower than 13 day EMA we seem to have a downtrend.
2) SMA:
We use 100 Day SMA to determine the strength of the support in the market.
When the Bank Nifty is higher than, 100 day SMA , it means that, Bank Nifty is in an uptrend, or has the potential to go upwards.
When the Bank Nifty goes below, 100 Day SMA, it means that, Bank Nifty is Catching a downtrend or has the potential to go downwards.
3) Trend Lines:
When the the Bank Nifty is clocking higher highs, then you can draw a trend LINE which, determines an uptrend.
When the Bank Nifty is clocking lower lows, then you can draw a trend line which determines a downtrend.
4) Fast Stochastic:
When fast stochastic is higher than 20, then Bank Nifty is either in an uptrend or has the potential to go upwards.
When the fast stochastic is higher than 90, then the Bank Nifty either Trends downwards or start a new downtrend.
5) Slow Stochastic:
When the Slow stochastic is higher than 20, then Bank Nifty is either in an uptrend or has the potential to go upwards.
When the Slow stochastic is higher than 90, then the Bank Nifty either Trends downwards or start a new downtrend.
6) MACD
When the MACD is positive, and is higher than the signal, MACD determines that the Bank Nifty has is there a potential to go higher are are is in an uptrend.
When the MACD is nagative, and is lower than the signal, MACD determines that the Bank Nifty has the potential to either go downward or, the Bank Nifty is already in a downtrend.
Lastly before you jump into trading bank nifty, understand what are the 11 requirements to trade in Indian Stock Markets.
Hope it has made you enough aware of the trend and gave you a clear image of future trading with technical analysis.
If you like it, share it with your friends in trading. Comment and connect with me 🙂
Happy Trading and Happy MoneY Making!