
Listen closely, retail traders often watch algoquant fintech share price swings without understanding how quantitative high-frequency market-making firms generate trading income. In real trading desks, we never evaluate fintech trading companies like ordinary manufacturing enterprises. Instead, we examine algorithmic latency, statistical arbitrage spread capture, and exchange turnover volume before taking live positions.
Here is the real deal about algorithmic trading operations on Dalal Street. Quantitative firms do not gamble on long-term directional trends. Instead, they capture minute price discrepancies across cash equity markets and index derivatives thousands of times every trading day.
Traders looking to build professional market instincts should explore our structured Basics of Stock Market Course to master order flow dynamics. In addition, reading our authoritative guide Kaliyiri Share Market Book provides battle-tested Dalal Street principles for managing volatile small-cap positions.
Algoquant Fintech Business Model and Quantitative Architecture
Let us keep it simple when dissecting how quantitative trading enterprises create shareholder value. A modern algorithmic trading house operates three core revenue engines. Each engine exploits distinct liquidity mechanics across Indian and global exchange platforms.
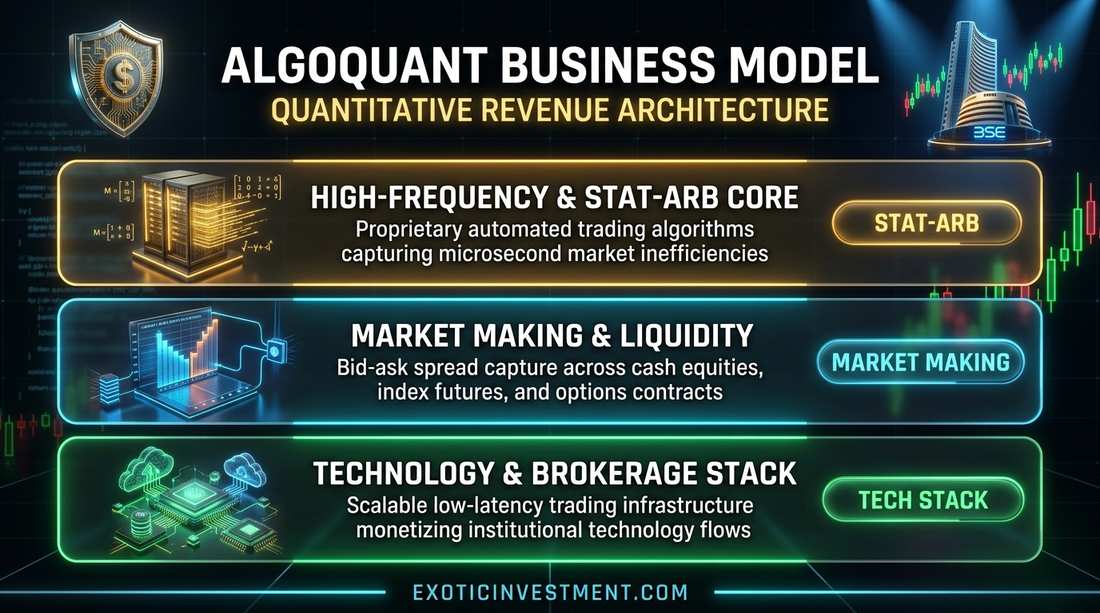
First, high-frequency statistical arbitrage forms the primary profit generator. Quantitative algorithms monitor correlations between individual stocks, sector indices, and futures contracts. When pricing models detect microsecond divergences, automated execution engines capture the spread instantly.
Second, market making and liquidity provision deliver dependable day-to-day revenue. By continuously placing simultaneous buy and sell limit orders in liquid contracts, the firm earns the bid-ask spread. During volatile trading sessions when retail volumes surge, market-making earnings expand substantially.
Third, low-latency technology infrastructure creates an enduring competitive advantage. Proprietary co-location server setups at exchange data centers process millions of order updates per second. This cutting-edge infrastructure prevents execution slippage and secures priority in order queue matching.
Before initiating trades in high-beta fintech stocks, active participants should model net gains with our Stock Profit Calculator to account for exchange transaction charges and STT. Traders also cross-check global volatility indices on eMintage crypto tracking to evaluate systemic risk sentiment.
Order-to-Trade Ratio Regulations and SEBI Surveillance Rules
Algorithmic trading firms operate under rigorous scrutiny from market regulators. The Securities and Exchange Board of India enforces strict Order-to-Trade Ratio (OTR) rules to prevent algorithmic quote stuffing and market manipulation. Under these regulations, brokerages and prop desks face financial penalties if their automated systems submit excessive order modifications or cancelations relative to executed trades.
For quantitative trading houses like Algoquant Fintech, managing OTR efficiency is a vital operational competency. Desks must design smart order routing algorithms that maximize trade fills while keeping cancelation ratios well within regulatory thresholds. When a firm fine-tunes its order placement models, it reduces exchange penalties and maximizes capital efficiency.
In addition, SEBI requires algorithmic code audits and pre-trade risk controls on all automated trading terminals. These controls include price band checks, maximum quantity limits per order, and cumulative turnover caps. Adhering strictly to these regulatory mandates ensures smooth daily exchange operations without costly compliance interruptions.
Algoquant Fintech Share Price Technical Levels and Mean Reversion Ranges
Analyzing trading patterns on the BSE requires keen attention to statistical mean reversion channels. Because quantitative firms experience earnings correlated with overall market turnover, their share prices frequently form distinct cyclical waves.
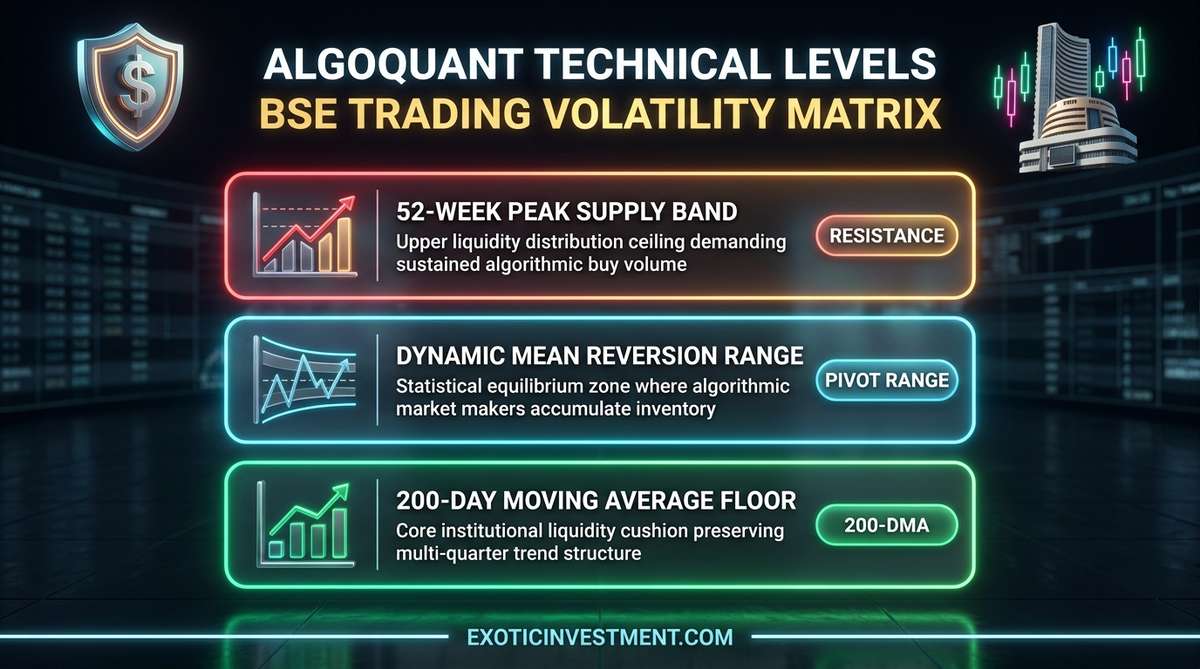
No confusion surrounds the 52-week peak supply barrier. When share prices touch historical highs, early pre-listing investors and short-term swing traders distribute inventory into retail demand. As a result, sustainable upward continuation demands heavy institutional cash delivery volume.
Beneath resistance lies the dynamic mean reversion range. In this zone, prices oscillate around 50-day and 100-day exponential moving averages while volatility stabilizes. Experienced traders observe that consolidation inside this band frequently precedes the next directional expansion leg.
At the base of the structure sits the 200-day moving average floor. This critical technical benchmark defines long-term structural institutional support. When weekly candles respect this moving average, smart money considers price pullbacks as constructive accumulation opportunities.
To keep brokerage commissions and turnover charges under control, traders rely on our free Indian Stock Brokerage Calculator. Calculating exact round-trip trade costs protects net trading returns across volatile swings.
Proprietary Arbitrage Capital Versus Client Brokerage Revenue
Retail investors often confuse proprietary trading firms with retail retail brokerages like Zerodha or Groww. Retail brokerages depend entirely on client account additions, subscription fees, and active user trading turnover. In contrast, proprietary algorithmic houses deploy their own corporate capital to capture market inefficiencies.
This structural distinction significantly alters corporate earnings dynamics. Proprietary trading firms do not carry customer acquisition costs, branch marketing expenses, or retail onboarding friction. When market turnover expands, their proprietary trading models scale trade sizes automatically without requiring corresponding hiring surges.
However, proprietary desks face direct market exposure risk. If algorithmic statistical correlations break down during unprecedented macroeconomic events, trading strategies can trigger immediate stop-out limits. Investors evaluating fintech trading firms must examine proprietary capital adequacy and risk management safeguards.
Algoquant Fintech Financial Ratios and Desk Comparison Table
Real market mentors evaluate proprietary trading desks using specific financial metrics tailored to quantitative market makers. The table below outlines key operational indicators that our trading desk monitors regularly.
Honestly speaking, quantitative firms that operate with zero long-term debt and high return on capital provide substantial operational resilience. When market turnover volumes break new records, their earnings capacity expands exponentially.
Quantitative Risk Controls and Portfolio Allocation Guidelines
Trading small-cap fintech enterprises requires disciplined risk parameters. Because algorithmic trading revenue can fluctuate with broader market volatility, smart investors enforce strict risk boundaries.
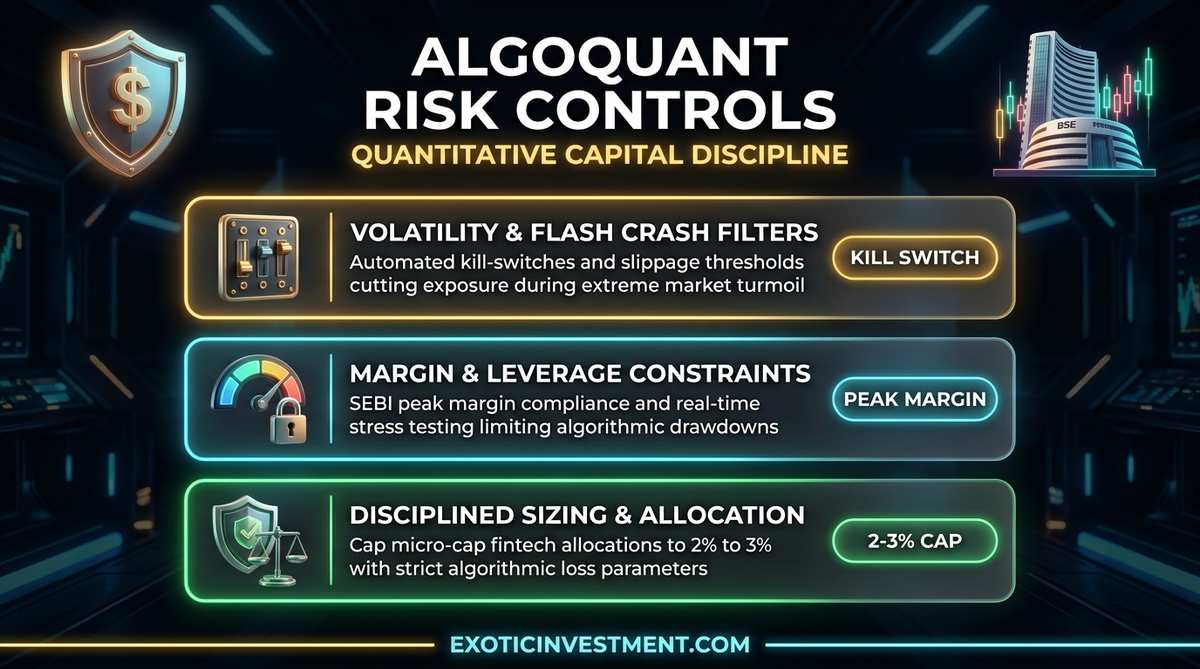
First, understand automated kill-switches and flash crash filters. High-frequency algorithms incorporate strict automated loss cutoffs that freeze trading if unexpected slippage occurs. While these mechanisms protect firm capital, they can cause temporary dips in quarterly trading volume.
Second, stay informed about SEBI peak margin requirements and regulatory adjustments. Changes in exchange margin regulations or algorithmic order-to-trade ratio fees directly impact operational efficiency. Prudent market participants follow regulatory circulars to anticipate shifts in industry profitability.
Third, limit overall portfolio exposure to 2% or 3% in micro-cap fintech counters. Practicing disciplined capital allocation ensures that unexpected sector turbulence never threatens your overall investment capital. Always trail stops behind validated chart pivots to preserve accumulated profits.
Step-by-Step Desk Blueprint for Algoquant Fintech Share Price
Executing entries in niche algorithmic stocks demands systematic preparation. Our Dalal Street trading desk follows this proven routine to capture optimal risk-to-reward setups.
- Monitor Exchange Turnover Trends: Check whether Indian cash equity and derivatives volumes are rising on NSE and BSE to confirm favorable macro industry conditions.
- Map Volume Breakout Anchors: Identify significant support and resistance bands on the daily chart. Wait for price consolidation near the 50-day moving average.
- Cap Position Allocation: Keep your allocation strictly between 2% and 3% of total portfolio value to guard against micro-cap volatility.
- Enforce Systematic Trailing Stops: Use the 20-day exponential moving average as your dynamic trailing floor. Lock in profits when price stretches excessively above historical bands.
Disciplined adherence to this execution plan removes emotional hesitation and preserves trading capital across every market phase.
Frequently Asked Questions About Algoquant Fintech Share Price
What is Algoquant Fintech’s primary business model?
Algoquant Fintech specializes in quantitative financial technology, algorithmic trading strategies, and market-making liquidity provision across Indian exchange platforms. The firm deploys proprietary automated execution engines to capture statistical arbitrage spreads.
Where can investors buy Algoquant Fintech shares?
Algoquant Fintech shares trade on the Bombay Stock Exchange (BSE) under its designated security scrip code. Investors can trade shares through any SEBI-registered stock broker via electronic demat accounts.
How does broader market volatility affect Algoquant Fintech share price?
Higher market volatility and expanded trading turnover generally benefit quantitative market makers by widening bid-ask spreads and increasing trading volume. However, investors should maintain prudent position sizing of 2% to 3% to handle stock-specific volatility.
What does the 5% BSE circuit filter mean for Algoquant Fintech traders?
The 5% daily circuit filter limits maximum daily price expansion or contraction. This safeguard limits intraday volatility but means orders may remain unexecuted if the stock reaches limit up or limit down bands.
Why is low balance sheet debt critical for algorithmic trading firms?
Zero debt balance sheets eliminate financial interest drag and provide operational freedom. This allows quantitative firms to allocate available working capital entirely to proprietary trading strategies and server technology.