
Nifty Technical Analysis shows it’s at the brink of a crush or a CRASH!
Can we easily assume Nifty can’t stand the global turmoil and it’s not a rock? I doubt it and kinda Not too!
Let’s analyze Nifty Technical charts to find out if Nifty a Hard Rock or Not!
Nifty a Hard Rock? Supporting Factors
Lets say we see Nifty as a Hard Rock, we should give supporting parameters supporting it. Let’s roll with the factors.
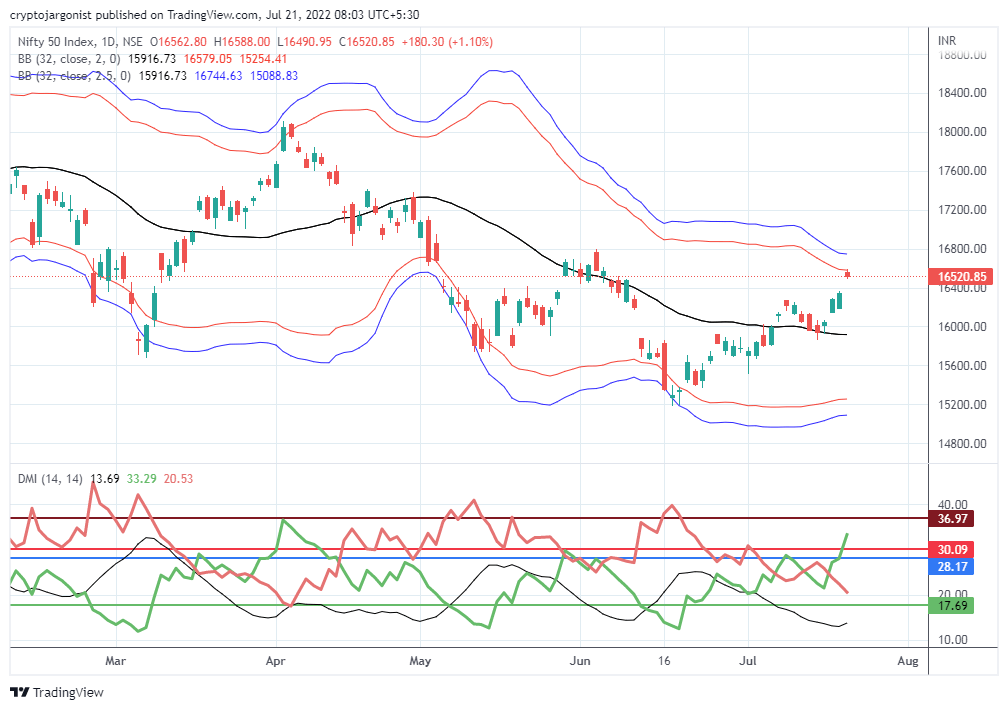
- The directional movement Indicator has surpassed the short-term resistance and moved higher. It’s very good news.
- Though we hit resistance at 16580 levels of Bollinger Band, we are very near to resistance and have not seen a huge cut.
- We’ve closed above key resistance at 16514 levels.
- We still have a chance that the Bollinger band blue level is reached before we peak.
- The chart pattern to this peak was more supportive than the previous.
Nifty a Titanic and Supporting Factors
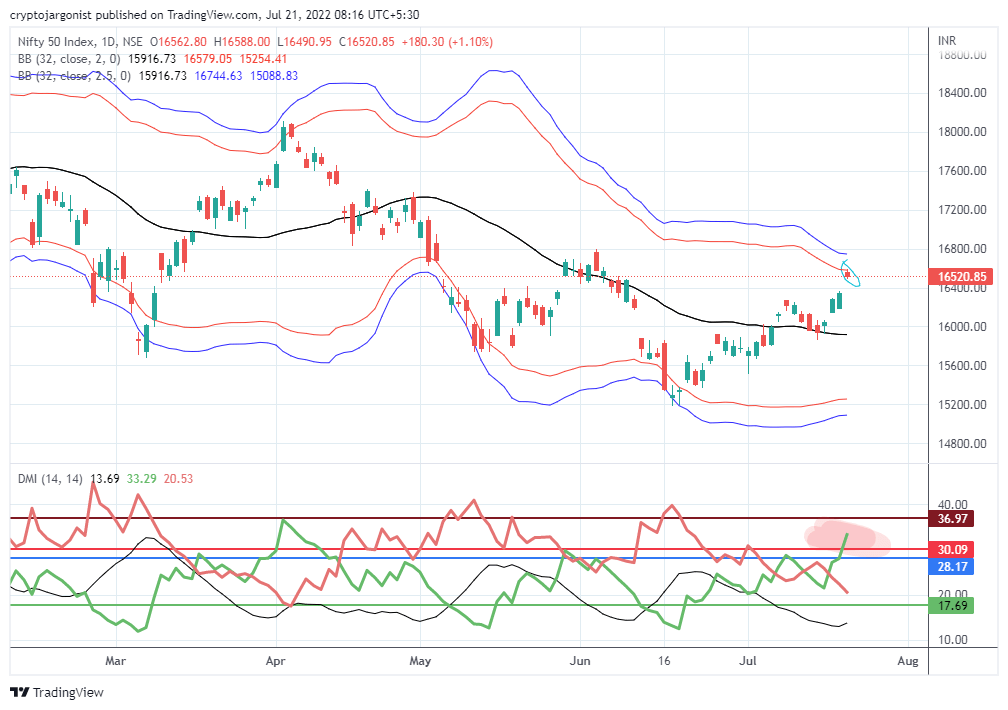
- The biggest resistance at 16579 levels was touched yesterday and we saw a 100-point shave-off from there.
- Though Directional Movement Indicator has crossed a resistance level, now it has entered a higher resistance zone.
- 16514 is a resistance, and Nifty is just above 16520, which is not supportive, an initial sell-off will see Nifty in the resistance zone.
- The median of Bollinger Band to the peak was just 4 candles, which shows profit booking will be more intense.
- Lower highs and lower lows of the downtrend that started from 18114 levels are intact and we may see a continuation of the down trend as we are at a peak now.
2) SGX Nifty Trend for Today on July 21, 2022:
Today on 21st July 2022 SGX Nifty is showing 25 Points HIGHER move at around 8:23 AM when I am writing this article.
SGX Nifty Trend on Live Chart denotes that the Indian Markets will react POSITIVE.
So Indian markets especially Nifty Trend Today would have a probably POSITIVE start.
3) World Market Analysis for 21 JULY 2022:
S&P 500: 23.20 (+0.59%)
NASDAQ: +190.26 (+1.55%)
Dow Jones: +47.79 (+0.15%)
Nikkei: -22.71 (-0.08%)
US Markets show good support, but the Nifty is on a brink of a breakdown and we may see a big downturn if we fall.
4) Nifty Supports and Resistances:
Nifty Supports: 16514, 16492, 16359, 16300
Nifty Resistances: 16600, 16579, 16514
GOOD READ: How To Choose The Best Option Strike Price For Landmark Success?
5) Nifty Chart Analysis for 21 July 2022 Conclusion:
- It’s apparent, that we may see some steam till 16579 levels and see a profit booking.
- Since we have a big resistance above, we will have a negative impact.
- As a result of this, a pull-down may result in a fall to 14800 levels.
MUST-READ: Can Day Trading Make You Rich For an Exhilarated Excuse Free Life?
Considering the trends globally and Technical Analysis Nifty Trend Today is hugely POSITIVE.
Follow me on Facebook and Youtube.
Happy Trading and Happy Money Making!