Nifty Trend Today — Support, Resistance & Projection Calculator

Nifty Trend Today — Support, Resistance & Projection Calculator

Nifty Trend Today support and resistance projection engine provides traders institutional pivot corridors, VIX-calibrated volatility bands, Bank Nifty levels, option strike mapping, and morning reports.

TODAY'S OPENING SETUP: 23,454.05 (+39.75 pts vs Prev Close 23,414.30) 🟢 Mild Gap-Up Open (+39.75 pts)
🔒PRO LOCKED
● LIVE NSE GIFT NIFTY: 23,333.00 VIX: 10.98
SELECT INDEX:
SESSION OHLC — NIFTY 50 ● UPSTOX LIVE FEED
PIVOT METHOD:
NIFTY 50 LIVE LTP
23,329.00
-85.30 (-0.36%)
🟢 BULLISH — Decisive Close Above Daily Pivot
CENTRAL PIVOT (P)
--
DAY'S RANGE
--
METHOD
CLASSIC
R2 (Resistance 2) --
R1 (Resistance 1) --
S1 (Support 1) --
S2 (Support 2) --
⚡ VIX 1-Sigma Expected Daily Range --
Calculated dynamically from current India VIX regime.
PRE-SESSION TRADE SETUP QUALITY SCORE: 78 / 100
HIGH QUALITY SETUP Strong trending alignment favor long positions.
CALL RESISTANCE STRIKES
--
PUT SUPPORT STRIKES
--

⚡ How the Nifty Trend Today Calculator Works in 4 Steps

1

Select Index & Method

Choose Nifty 50 or Bank Nifty to view current session levels, and select Classic, Camarilla, or Fibonacci pivot methods to project levels.

2

Read S/R Levels

Support (S1–S2) marks institutional demand floors, while Resistance (R1–R2) highlights supply ceilings to manage risk against.

3

Check VIX Range

Verify if the pivot corridor fits within the 1-sigma daily expected move calculated from India VIX before placing breakout trades.

4

Map Option Strikes

Map R1/R2 to Call strikes and S1/S2 to Put strikes to confirm open interest boundaries on the official NSE option chain.

Institutional Nifty Trend Today Analysis & Volatility Geometry

Tracking the Nifty Trend Today requires looking beyond raw price action. Standard pivot points are only as effective as the underlying volatility context. On high-volatility sessions with India VIX above 15, classic S1/R1 levels are frequently breached because they assume an average range distribution. By integrating VIX-calibrated 1-sigma expected bands alongside Classic, Camarilla, and Fibonacci pivots, professional index traders obtain an institutional edge.
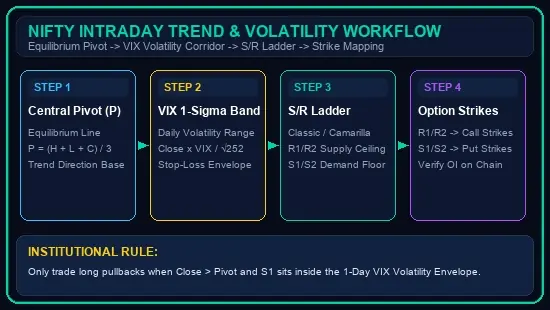
Nifty Trend Today Intraday Workflow and Volatility SR Corridor

Why Nifty Trend Today Relies on VIX 1-Sigma Expected Bands

India VIX represents the expected annualized volatility of the Nifty 50 over the next 30 days. To convert this into an intraday standard deviation, the formula divides VIX by the square root of 252 trading sessions. When evaluating the Nifty Trend Today, if S1 sits well within the 1-sigma boundary, it serves as a high-probability bounce floor. Official settlement data can always be cross-referenced on the National Stock Exchange of India (NSE).

Connecting Nifty Trend Today Support & Resistance to Option Strikes

Support and resistance levels should never be traded in isolation. When analyzing the Nifty Trend Today, if the index approaches R1 near 23,500, cross-check our live NSE Option Chain Live to see if Call open interest is aggressively building at the 23,500 CE strike. To model derivative risk and Greeks before taking trades, test position structures on our Black-Scholes Greeks Calculator. For strict trade sizing, calculate lot allocations with our Kelly Criterion Position Sizing Calculator and compute transaction frictions on the Indian Stock Brokerage Calculator. Review regulatory guidelines published by the Securities and Exchange Board of India (SEBI).

📋 Regulatory References & Data Sources
  • Black-Scholes-Merton (1973) option pricing model
  • SEBI circular SEBI/HO/MRD/DP/CIR/P/2019 — F&O margin framework
  • NSE circular NSE/CMPT/39170 — SPAN margin methodology
  • Securities Contracts (Regulation) Act 1956, as amended

Disclaimer: This calculator is for educational and planning purposes only. It does not constitute financial advice. Consult a SEBI-registered investment advisor for personalised guidance. Tax rules are updated as per the latest Finance Act — verify with a qualified CA before filing.

💡 Frequently Asked Questions About Nifty Trend Today

What is the Nifty Trend Today and how is the primary pivot calculated?

The Nifty Trend Today reflects the intraday directional bias of the benchmark index. The central pivot point is computed as P = (High + Low + Close) / 3 from the prior session. Support (S1/S2) and resistance (R1/R2) levels radiate outward to create boundaries. For equity shares, compute individual pivots with our Pivot Point Calculator for Indian Stocks.

How does India VIX influence the Nifty Trend Today?

India VIX measures 30-day market volatility expectations. The 1-sigma daily range is calculated as Close × (VIX / 100) / √252. When assessing the Nifty Trend Today, an elevated VIX broadens the expected price swing, warning options sellers against placing strikes too close to the money. For crypto momentum and volatility screening, explore Emintage.

What is the difference between Classic, Camarilla, and Fibonacci pivots?

Classic pivots use arithmetic intervals suited for general range-trading. Camarilla pivots calculate 8 tight levels where H3/L3 act as mean-reversion zones and H4/L4 act as breakout levels. Fibonacci pivots incorporate 38.2% and 61.8% golden ratios. Compare 3-line boundaries on our Central Pivot Range (CPR) tool.

How can I confirm the Nifty Trend Today using option chain data?

Examine the strike-wise open interest concentration. If the Nifty Trend Today indicates resistance at R1 (e.g. 23,500), check whether the highest Call Open Interest sits at 23,500. A heavy Call base validates the ceiling. Track live Open Interest and PCR on our NSE Option Chain Live.

How do I share the Nifty Trend Today morning report on WhatsApp?

Click the green ‘Share Morning Report on WhatsApp’ button above the calculator. It automatically formats today’s Pivot, R1/R2, S1/S2, VIX, PCR, and setup quality score into a clean trading summary ready to send with one click.

How does the pre-session trade quality score work?

The pre-session algorithm evaluates gap magnitude, pivot corridor alignment, India VIX regime, and overnight momentum. A score above 75 signals clean trend conditions, while scores below 50 indicate choppy range-bound chop where options selling or staying on cash is optimal.

Can I analyze Bank Nifty using this tool?

Yes. Simply click the ‘Bank Nifty’ index pill on top. The calculator switches data instantly and recalibrates all pivot levels, Camarilla boundaries, and VIX volatility corridors for Bank Nifty.

How do I manage risk and position sizing on index trades?

Never risk more than 1-2% of total trading capital per trade. Calculate optimal contracts and stop-loss allocation using our Kelly Criterion Position Sizing Calculator and verify break-even turnover on the Indian Stock Brokerage Calculator.

Where can beginners learn index technical analysis and price action?

Master candlesticks, support-resistance dynamics, and breakout strategies through our Basics of Stock Market Course and read our comprehensive guides in Basics of Indian Stock Market Book and ಕಲಿಯಿರಿ ಶೇರ್ ಮಾರ್ಕೆಟ್.

How do institutional traders use the Nifty Trend Today for options selling?

Institutional desks sell Out-of-the-Money Call options above R2 and Put options below S2 when India VIX is benign, harvesting theta decay. Unlock institutional live scans with our Multibagger Pro Tools Pack.
AR
Written & Verified By

Dr.Ashok Kumar N Rao

Stock Market Educator & Author | 3,500+ Students Trained

Alternative Investments advisor and author of 'Basics of Stock Market for Beginners' and 'ಕಲಿಯಿರಿ ಶೇರ್ ಮಾರ್ಕೆಟ್'. All financial tools and content on this site are reviewed personally before publication.