PE Ratio Calculator
Calculate stock PE ratio online, find forward PE, and analyse historical average PE — all in one free tool for Indian equity investors.
PE Ratio Calculator
Enter PE values separated by commas. Each value represents one quarter or year.
₹500
₹20.00
18x
₹—
—
🔗
Also Try These Calculators
📈
Reverse CAGR Calculator
Find what CAGR you need to hit any financial goal →
💵
Lumpsum Investment Calculator
Project one-time investment growth & CAGR returns →
📉
Beta Calculator — Indian Stocks
Measure a stock’s risk vs Nifty 50 index →
💹
Rate of Return Calculator
Calculate actual % returns on any stock investment →
💰
Step-Up SIP Return Calculator
Model SIP returns with annual step-up contributions →
🧮
Stock Market Average Calculator
Average down your cost basis across multiple buys →
Unlock Pro Analytics
Get Intrinsic Value (Graham Formula), Margin of Safety %, PEG Ratio calculation, and forward PE analysis — all calibrated for Indian equity markets.
⚡ How the PE Ratio Calculator Works
Most investors know about the PE ratio but few know how to calculate PE ratio quickly in practice. So this tool gives you three modes: a basic PE calculator, a forward PE ratio calculation tab, and a historical average PE analyser. Here is how to use each one.
Choose Your PE Mode
Pick Basic PE to calculate stock PE ratio from price and EPS. Switch to Forward PE for future earnings estimates. Use the Historical tab to calculate historical PE ratio averages over multiple periods.
Enter Price and EPS
Type in the current market price and the earnings per share. The PE ratio stock price calculator updates instantly as you type. No submit button needed.
Read Your Valuation Verdict
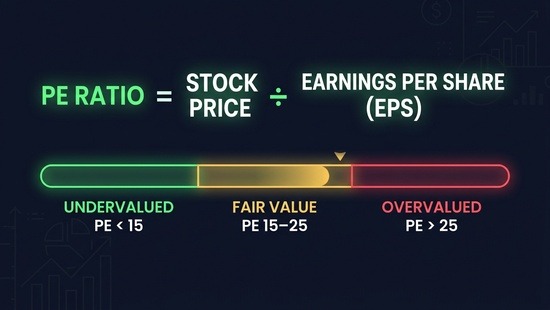
The zone bar shows where your stock sits — undervalued, fairly valued, or overvalued. Compare it to the sector average PE to see if you are paying a premium or getting a discount.
Share or Save Your Analysis
Copy a pre-filled shareable link, post your findings to WhatsApp, or save your PE analysis to your Pro profile for future reference.
🎓 Master Intraday Trading & Technical Analysis Basics!
Want to master technical analysis, spot breakouts, and configure risk average levels like a professional trader? Enroll in our top-rated basics of stock market course today!
Frequently Asked Questions