Upgrade to Premium to unlock dual-axis P/E vs Growth scatter plots, dividend total return PEGY breakdowns, 5-year historical PEG trend models, and the PEG-implied growth solver.
Growth-adjusted stock valuation standardizes earnings multiples against expansion rates. Use this 4-step framework to evaluate stock prices.
1
Input Stock & EPS Data
Enter current market price, trailing TTM EPS, forward projected EPS, and annual dividend per share. Select your evaluation basis.
2
Define Growth Forecast
Input expected annual EPS growth rate (%), choose between manual estimates, 5-year historical CAGR, or analyst consensus projections.
3
Select Sector Context
Pick your stock’s industry sector to pre-fill median P/E and PEG multiples or enter custom industry parameters for comparison.
4
Review Valuation & Fair Price
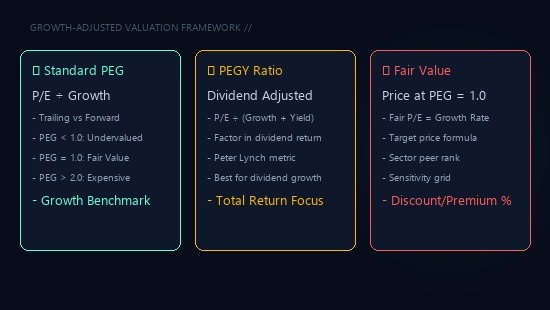
Examine trailing PEG, forward PEG, PEGY ratio, fair value target price at PEG = 1.0, and growth sensitivity matrices.
🎓 Master Equity Valuations & Stock Selection!
Want to master financial ratio analysis, spot undervalued growth compounders, and build long-term investment models like professional analysts? Enroll in our top-rated basics of stock market course today!
What is a peg ratio calculator and why is it essential for growth stocks?
A peg ratio calculator evaluates stock valuation by adjusting the Price-to-Earnings (P/E) ratio by expected earnings growth rates. High P/E stocks can be cheap if growth is exceptionally fast. Evaluate dividend stocks on our Dividend Discount Model Calculator.
How to calculate peg ratio using trailing and forward earnings?
To learn how to calculate peg ratio, divide the stock’s P/E ratio by its annual EPS growth percentage. Trailing PEG uses historical TTM EPS, while forward PEG uses next 12-month projected EPS. Check option volatility expectations using the Black-Scholes Greeks Calculator.
What is a pegy ratio and how does it adjust for dividend yield?
A pegy ratio is Peter Lynch’s variation of the PEG ratio that adds dividend yield to the growth rate in the denominator: PEGY = P/E ÷ (Growth + Yield). This ensures high-yield dividend growth stocks are fairly evaluated. Try calculating price-to-earnings ratios on our PE Ratio Calculator.
When should investors use a forward PEG ratio instead of trailing PEG?
A forward PEG ratio uses projected 12-month analyst consensus earnings estimates. This is ideal for fast-expanding companies undergoing business turnarounds where past earnings do not reflect future capacity. Compare multi-asset growth targets on the Lumpsum Investment Calculator.
What is the price earnings to growth ratio formula used by equity analysts?
The price earnings to growth ratio formula is PEG = (Stock Price ÷ EPS) ÷ Annual EPS Growth Rate (%). A result under 1.0 indicates a potential buying opportunity. Solve compound interest returns using our Step Up SIP Return Calculator.
How do you determine the fair value PEG ratio target of 1.0?
The fair value PEG ratio target of 1.0 assumes a stock’s P/E ratio should equal its annual earnings growth rate. When PEG equals 1.0, the stock is considered fairly priced for its growth speed. Analyze target growth rates on the Reverse CAGR Calculator.
Why is a growth-adjusted P/E ratio superior to standard P/E multiples?
A growth-adjusted P/E ratio prevents investors from overpaying for slow-growing value traps or avoiding fast-growing compounders. Standard P/E ignores growth velocity. Plan derivative trading taxes using the F&O Turnover Calculator (ITR).
How does a PEG ratio calculator India framework adapt to local markets?
A PEG ratio calculator India assessment benchmarks Indian stocks against NSE/BSE sector medians like IT, Banking, FMCG, and Pharma. Local interest rates and GDP expansion rates shape these baselines. Check stock market index volatility on the Beta Calculation for Indian Stocks page.
Is a PEG ratio below 1.0 always a buy signal?
Not necessarily. A PEG ratio under 1.0 indicates cheapness relative to growth forecasts, but investors must verify earnings quality and debt levels to avoid value traps. Check retirement funding targets on our Retirement Corpus Calculator.
How does dividend yield impact valuation multiples?
Dividends provide cash returns independent of share price appreciation. Adding dividend yield to growth when calculating PEGY gives a total return perspective. Learn about asset growth schedules on our Stock Market Average Calculator.
!
Oops! Adblocker Detected.
The revenue we earn by the advertisements is used to manage this website, we request you to disable adblock plugin or whitelist our website in your adblocking plugin.