Dividend Discount Model Calculator

Dividend Discount Model Calculator

Use this multi stage dividend discount model calculator to solve the intrinsic value of dividend paying stocks, calculate the required rate of return, and evaluate dividend safety scores.

DDM Stock Valuation

Section A: Stock Basics
Section B: Required Return & Gordon Growth
Section E: Dividend Safety Inputs
DDM Intrinsic Value
₹0.00
UNDERVALUED
Intrinsic Value ₹0.00
Margin of Safety 0%
Dividend Yield 0%
Dividend Payout Ratio 0%
FCF Dividend Coverage 0%
Dividend Safety Score Safe 🟢
Discount Rate (Required Return) 10%
Terminal Value PV ₹0.00
Projected Dividends PV Table
Year Expected Div Present Value
Sensitivity Matrix (Intrinsic Value)
Cols: Discount Rates (r) | Rows: Terminal Growth (g)
PEGY Valuation RatioPRO 🔒 Locked
Residual Income Model comparisonPRO 🔒 Locked
Historical Dividend growth streak CAGRPRO 🔒 Locked
Sustainable Growth Rate solverPRO 🔒 Locked
Implied Growth Rate solverPRO 🔒 Locked
⚠️ High Terminal Growth Rate: Terminal growth rate exceeds 5% — long-run growth cannot exceed nominal GDP. Consider reducing.
💡 High Payout Ratio Alert: Payout ratio above 80% — dividend may not be sustainable. FCF coverage should be checked.
🟢 Consistent growth history: Dividend has grown for consecutive years — strong safety signal.
📲 Share on WhatsApp
×

👑 Unlock Pro Analytics

Upgrade to the Premium Plan to unlock the PEGY ratio valuation, Residual Income comparison module, Sustainable growth rate ROE solver, and the market-implied growth rate model.

🚀 Get Pro — Add to Cart

⚡ How the Multi Stage Dividend Discount Model Calculator Works

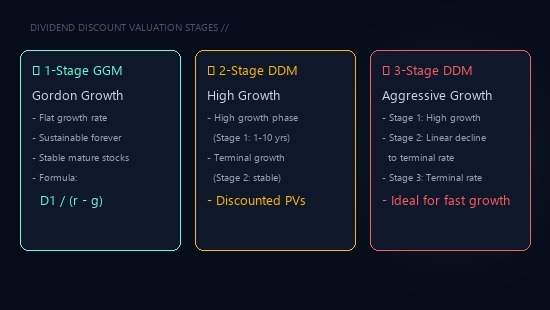
Estimating the fair value of stock equity using future payout projections requires multi-stage discounting models. This tool automates the process using a 4-step financial framework.
multi stage dividend discount model calculator
1

Select Valuation Model

Choose between the 1-Stage Gordon Growth Model (GGM), 2-Stage DDM (high growth + stable), or 3-Stage DDM (aggressive growth + linear decline + terminal growth).

2

Estimate Discount Rate

Input your manual required return rate or solve it dynamically using the CAPM (Capital Asset Pricing Model) formula by specifying risk-free rate, beta, and equity risk premium.

3

Evaluate Dividend Safety

Enter earnings and cash flows. The model automatically weights payout coverage, FCF health, leverage ratios, and streaks to compute safety scores.

4

Analyze Sensitivities

Review the calculated intrinsic value, margin of safety verdict, stage-by-stage payout schedules, and the discount-vs-growth sensitivity matrix.

🎓 Master Stock Market Intrinsic Valuations!

Want to master technical analysis, spot undervalued dividend growth breakouts, and construct long-term investment models like a hedge fund analyst? Enroll in our top-rated basics of stock market course today!

🎓 ENROLL IN BASICS OF STOCK MARKET COURSE NOW 🚀

💡 Frequently Asked Questions (FAQs)

What is a multi stage dividend discount model calculator and when is it used?

A multi stage dividend discount model calculator evaluates stock intrinsic value by projecting dividends across multiple growth stages. Typically, this is used for high-growth firms transitioning into stable dividend-paying maturity. Check other portfolio tools like the Lumpsum Investment Calculator.

How does a Gordon growth model calculator differ from multi-stage models?

A Gordon growth model calculator assumes a flat dividend growth rate forever. In contrast, multi-stage models allow growth rates to transition and decline toward terminal limits. Check how stock returns average over time on our Stock Market Average Calculator.

How is a dividend discount model India assessment structured?

A dividend discount model India valuation uses local risk-free rates (typically Indian 10-year G-sec yields around 7%) and equity premiums to discount future rupee payouts to present value. Analyze standard trading metrics on the F&O Turnover Calculator (ITR) page.

What is the intrinsic value dividend stock threshold for safety?

The intrinsic value dividend stock threshold represents the discount-adjusted PV of all projected dividends. Buying a stock below this threshold provides a margin of safety against market downturns. Solve growth assumptions on our Reverse CAGR Calculator.

Can you explain the DDM formula step by step for retail investors?

Yes. The DDM formula step by step calculates the present value of each expected dividend payment and adds the present value of the terminal price. This isolates how much future cash flows are worth today. Try calculating price to earnings thresholds on the PE Ratio Calculator.

Why use a two stage DDM calculator instead of single stage?

A two stage DDM calculator handles rapid expansion. Stage 1 projects high growth for 1-10 years, and Stage 2 models the terminal phase, preventing overvaluation. Evaluate retirement income on our Retirement Corpus Calculator.

What is a PEGY ratio calculator and how is it used?

A PEGY ratio calculator adjusts the standard PEG ratio by adding dividend yield to the denominator. This highlights value in high-yield dividend growth stocks. Read more on our Step Up SIP Return Calculator.

How is a dividend safety score calculator score calculated?

A dividend safety score calculator weighs four factors: EPS payout ratio, free cash flow coverage, leverage ratio, and the length of the consecutive growth streak. Plan options pricing using the Option Pricing and Payoff Calculator.

How do I determine the required rate of return CAPM discount rate?

The required rate of return CAPM method uses the formula: Risk-Free Rate + Beta × (Market Return – Risk-Free Rate). This adjusts the required return for the stock’s specific market risk. Solve beta values on the Beta Calculation for Indian Stocks page.

Is the DDM model reliable for high-payout stocks?

Yes, but if the payout ratio exceeds 80%, the dividend is at risk of being cut. Always cross-check FCF dividend coverage. Evaluate standard stock profit targets using the Stock Profit Calculator (INR).