DRIP vs Dividend Payout Calculator — Reinvestment Modeler
Compare the wealth multiplier of automatic Dividend Reinvestment Plans (DRIP) against cash dividend payouts over 5 to 30-year compounding horizons.
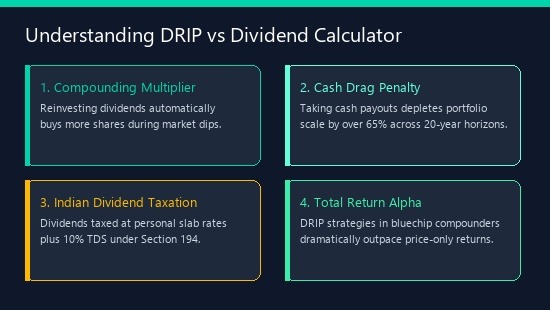
Reinvesting post-tax dividends continuously purchases more shares, creating an escalating income snowball that drastically widens the wealth gap over 15 to 20 years.
How It Works in 4 Steps
Enter Initial Capital
Input your starting stock portfolio or dividend champion investment value in INR.
Set Dividend Yield
Specify the average trailing dividend yield of your portfolio (default 3.5%).
Define Horizon & Tax
Select investment duration from 1 to 30 years and your personal income tax slab.
Compare Wealth Gap
View the compounding divergence between DRIP reinvestment and cash withdrawals.
The Exponential Divergence of Dividend Reinvestment
Dividends are one of the most tangible rewards of long-term equity investing. However, taking dividend payouts in cash creates a massive compounding penalty known as cash drag. When dividends are spent or parked in low-interest savings accounts, they stop compounding.
Under a Dividend Reinvestment Plan (DRIP), every rupee of post-tax dividend income is immediately redeployed to purchase additional shares. During market drawdowns, these reinvested dividends accumulate shares at heavy discounts, accelerating portfolio yield-on-cost over 15 to 20 years.
📋 Regulatory References & Data Sources
- AMFI (Association of Mutual Funds in India) — SIP return methodology
- SEBI (Mutual Funds) Regulations 1996, as amended
- Historical Nifty 50 CAGR data: NSE India, FY 1994-2026 (12% avg)
Disclaimer: This calculator is for educational and planning purposes only. It does not constitute financial advice. Consult a SEBI-registered investment advisor for personalised guidance. Tax rules are updated as per the latest Finance Act — verify with a qualified CA before filing.
Explore Related Analysis Engines
Frequently Asked Questions — DRIP vs Dividend Payout Calculator — Reinvestment Modeler