Indian Nifty is the part and parcel of a Day Traders Chest of Tools.
Without looking at the Indian Nifty charts early morning, trading wouldn’t start.
Any me a full time trader and Nifty Options trader, cannot any day go without an Indian nifty chart.
Nifty Trend Today is the first thing I blog about daily.
I do an analysis of the Indian Nifty Trend using multiple indicators using the following:
- SGX Nifty Trend
- Global Markets Trend
- Technical Analysis
I usually trade in Nifty options or Nifty Futures. For Options writing or Nifty Futures, we need Nifty Futures Margin.
Nifty Futures trading time for me is from 9:30 Am – 11:30 AM and 1:30 – 3:30PM due to the trending pattern.
I like to scalp in between during the sideways market, which I teach in my options trading course.
Without further ado, let’s jump into learning everything about CNX Nifty.
If you are looking to get the most technical analysis knowledge for Free, then Get my Free eBook.
==> Candlestick and Technical Analysis Trading Patterns and Strategy FREE eBook
Indian Nifty Start Date:
Nifty 50 started trading on the National Stock Exchange on the day of 22nd April 1996.
Indian Nifty Chart:
Indian Nifty Companies and its weightage in the Index:
Nifty was previously traded at the full market capitalization method.
However, from 26th June 2009, free float methodology came into existence.
Full market capitalization means the full amount of shares of the company are calculated on market value. After this parameter, Nifty was weighted ealier.
Now free-float capitalization means, only the company shares available for public trading. Thi is what is considered for market capitalization for weightage calculation of Nifty.
| Sl.No. | Company Name | Sector | Weightage in Nifty |
| 1 | Reliance Industries Ltd. | Petroleum Products | 10.20% |
| 2 | HDFC Bank Ltd. | Banks | 9.73% |
| 3 | Infosys Limited | Software | 7.94% |
| 4 | Housing Development Fin. Corp. Ltd.£ | Finance | 6.89% |
| 5 | ICICI Bank Ltd. | Banks | 6.57% |
| 6 | Tata Consultancy Services Ltd. | Software | 4.97% |
| 7 | Kotak Mahindra Bank Limited | Banks | 4.06% |
| 8 | Hindustan Unilever Ltd. | Consumer Non Durables | 3.32% |
| 9 | Axis Bank Ltd. | Banks | 2.84% |
| 10 | ITC Ltd. | Consumer Non Durables | 2.80% |
| 11 | Larsen and Toubro Ltd. | Construction Project | 2.56% |
| 12 | Bajaj Finance Ltd. | Finance | 2.29% |
| 13 | State Bank of India | Banks | 2.15% |
| 14 | Bharti Airtel Ltd. | Telecom – Services | 2.05% |
| 15 | Asian Paints Limited | Consumer Non Durables | 1.81% |
| 16 | HCL Technologies Ltd. | Software | 1.54% |
| 17 | Maruti Suzuki India Limited | Auto | 1.36% |
| 18 | Tata Steel Ltd. | Ferrous Metals | 1.27% |
| 19 | UltraTech Cement Limited | Cement & Cement Products | 1.15% |
| 20 | Wipro Ltd. | Software | 1.15% |
| 21 | Mahindra & Mahindra Ltd. | Auto | 1.14% |
| 22 | Sun Pharmaceutical Industries Ltd. | Pharmaceuticals | 1.12% |
| 23 | JSW Steel Ltd. | Ferrous Metals | 1.10% |
| 24 | Bajaj Finserv Ltd. | Insurance | 1.06% |
| 25 | Dr Reddys Laboratories Ltd. | Pharmaceuticals | 0.99% |
| 26 | Titan Company Ltd. | Consumer Durables | 0.98% |
| 27 | Tech Mahindra Ltd. | Software | 0.94% |
| 28 | Nestle India Ltd. | Consumer Non Durables | 0.92% |
| 29 | Power Grid Corporation of India Ltd. | Power | 0.89% |
| 30 | HDFC Life Insurance Company Limited | Insurance | 0.87% |
| 31 | Grasim Industries Ltd. | Cement & Cement Products | 0.85% |
| 32 | Adani Ports & Special Economic Zone | Transportation | 0.84% |
| 33 | Hindalco Industries Ltd. | Non – Ferrous Metals | 0.84% |
| 34 | Indusind Bank Ltd. | Banks | 0.83% |
| 35 | Tata Motors Ltd. | Auto | 0.83% |
| 36 | Divis Laboratories Ltd. | Pharmaceuticals | 0.82% |
| 37 | Bajaj Auto Limited | Auto | 0.79% |
| 38 | NTPC Limited | Power | 0.77% |
| 39 | Cipla Ltd. | Pharmaceuticals | 0.73% |
| 40 | Britannia Industries Ltd. | Consumer Non Durables | 0.64% |
| 41 | Tata Consumer Products Limited | Consumer Non Durables | 0.63% |
| 42 | Bharat Petroleum Corporation Ltd. | Petroleum Products | 0.62% |
| 43 | Oil & Natural Gas Corporation Ltd. | Oil | 0.62% |
| 44 | Shree Cement Ltd. | Cement & Cement Products | 0.59% |
| 45 | Hero MotoCorp Ltd. | Auto | 0.58% |
| 46 | SBI Life Insurance Company Ltd. | Insurance | 0.57% |
| 47 | Eicher Motors Ltd. | Auto | 0.53% |
| 48 | UPL Ltd. | Pesticides | 0.53% |
| 49 | Coal India Ltd. | Minerals/Mining | 0.44% |
| 50 | Indian Oil Corporation Ltd. | Petroleum Products | 0.37% |
Indian Nifty Prediction:
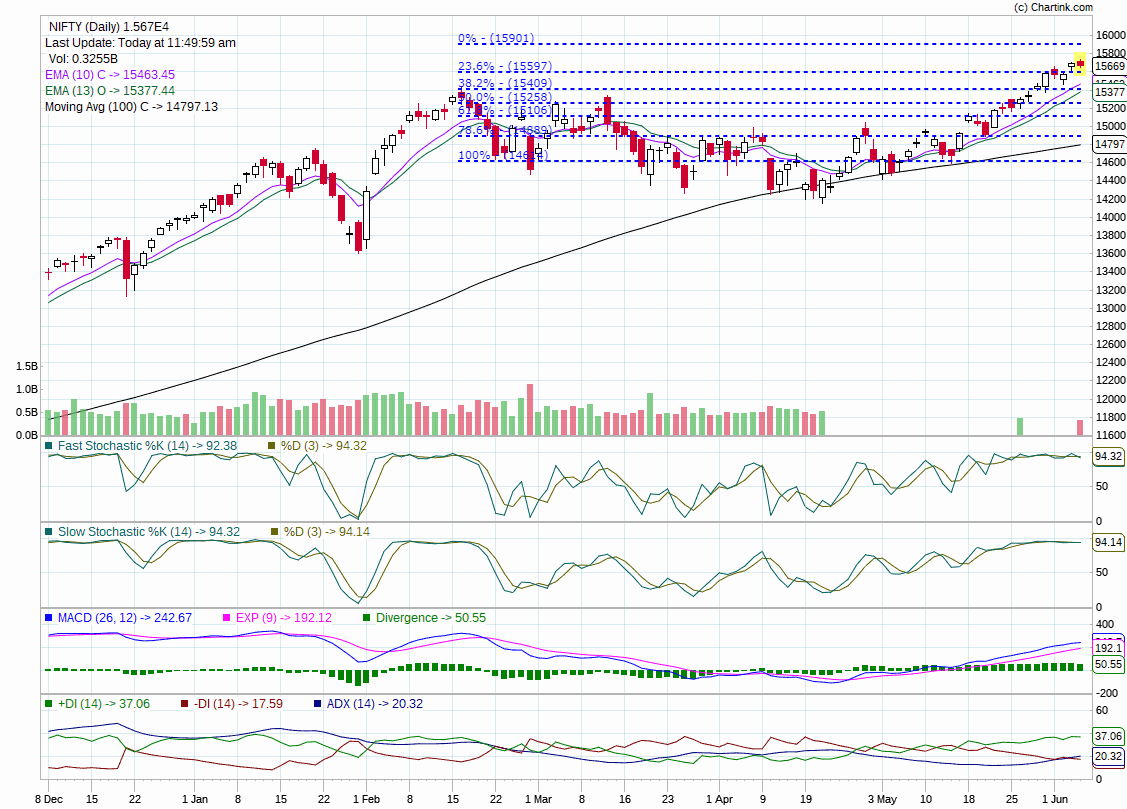 Chart by ChartInk
As a result of Fibonacci retracement, Indian Nifty prediction is to reach the level of 15901 in upcoming sessions.
Fibonacci retracement is the ultimate tool to find the future highs and targets in the market.
With about 55% technical analysts using fibonacci retracement for the predictions, makes it so accurate.
As a result, it’s accuracy is shart as a tack.
How did I predict it, read yourself, Fibonacci retracement vs Fibonacci extension blog post.
Indian Nifty Trend:
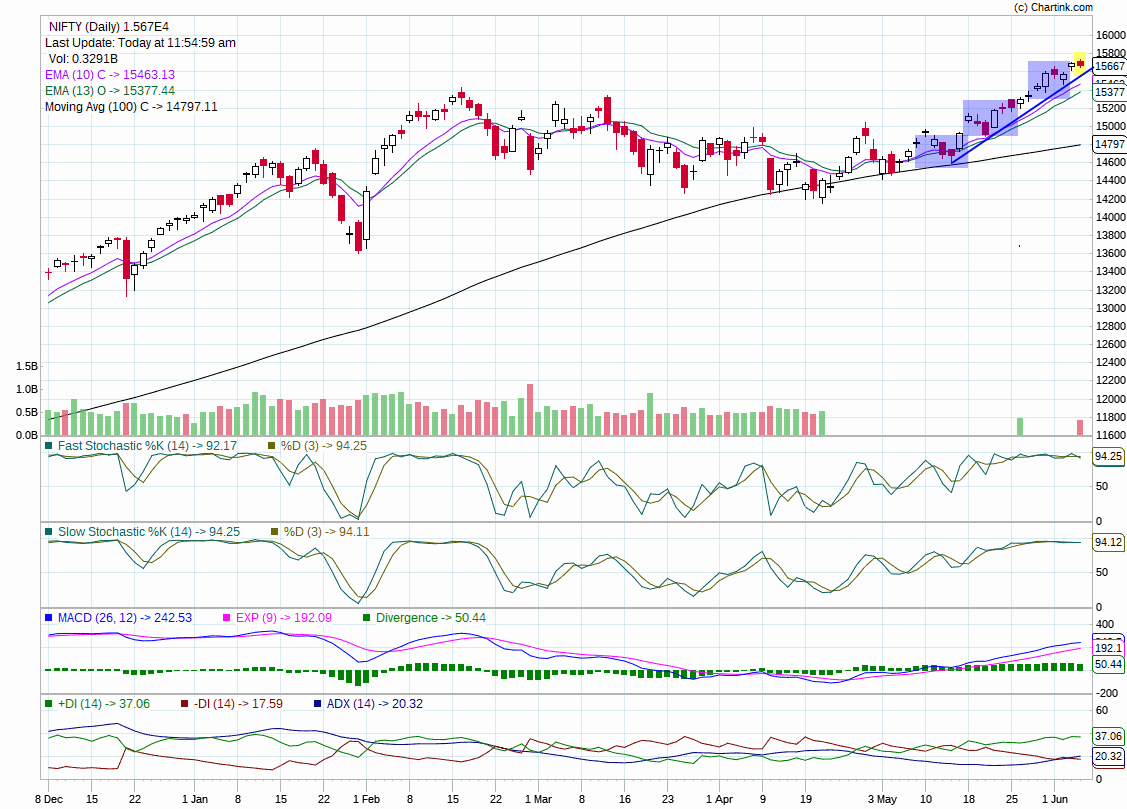
The nifty trend is predicted based on higher highs and higher lows.
The EMAs make way to higher highs as its a leading indicator unlike SMA.
Since the nifty is continuously clocking higher highs and higher lows, the Nifty trend is UP.
Also, look at the trend line drawn in the chart, it is sure shot Up as of Now!
Highest Points Achieved By Indian Nifty:
Nifty has the highest run of 2344.9 points in 2017.
Nifty is currently at an all-time lifetime high of 15733.
Year on year till date, Nifty has achieved a gain of 12.4%.
Usually, 12.4% was not even achieved in a couple of years, but this year, it’s not even half, but here it is.
Why is Nifty the Most Traded on Stock Exchanges?
The index is the culmination of all the company weightage.
Though multiple companies move is connected to Nifty, Nifty is the most easily predictable.
As a result of this, Nifty is more user-friendly to trade in futures as well as options.
Also, Nifty is the most traded due to the fact that its liquidity is the highest.
At any point in time, you can buy or sell the futures or options, without the least doubt will it sell at that price.
Considering all these Nifty is the highest traded on stock exchanges.
If this article has gained value for you, please share the article with others and let them benefit too.
Happy Trading and Happy Money Making!