How To Read The Technical Stock Chart is the preliminary question popped by beginners in technical analysis.
Technical Stock Chart Analysis is not rocket science. But it requires a lot of dedication to reading the right way for beginners.
Yesterday, I blogged about Fibonacci retracement vs extension. Check that out if at all you haven’t already.
When you do Stock Trading as a Job, you’ll realize one thing, which is the importance of technical analysis.
It’s a fundamental right of any trader to know technical analysis for day trading. Because the whole world relies on technical analysis for profit booking.
As a beginner, I had a real problem with how to read the technical stock chart. As a result of this, I began taking trades based on intuition which means I was gambling with stock trading!
So I want to give it back to the community about how to read the technical stock chart?
There are 1000s of moving parts to the technical stock chart analysis. There are indicators, there are strategies, there are chart patterns, etc.
Putting all the parts of the puzzle together is the hardest part and requires due diligence on your part.
As a matter of fact, it’s not important to learn each and everything in the technical analysis. Only the main strategies and indicators used by the technical analyst’s camaraderie are important.
I’ll teach you exactly that in today’s post on how to read the technical stock chart.
What will you learn in how to read the technical stock chart?
- Candlestick Charts
- Doji Patterns
- Price Action Patterns
- Different Indicators
- Strategy to Trade
Let’s jump and understand how to read the technical stock chart.
1) Candlestick Charts:
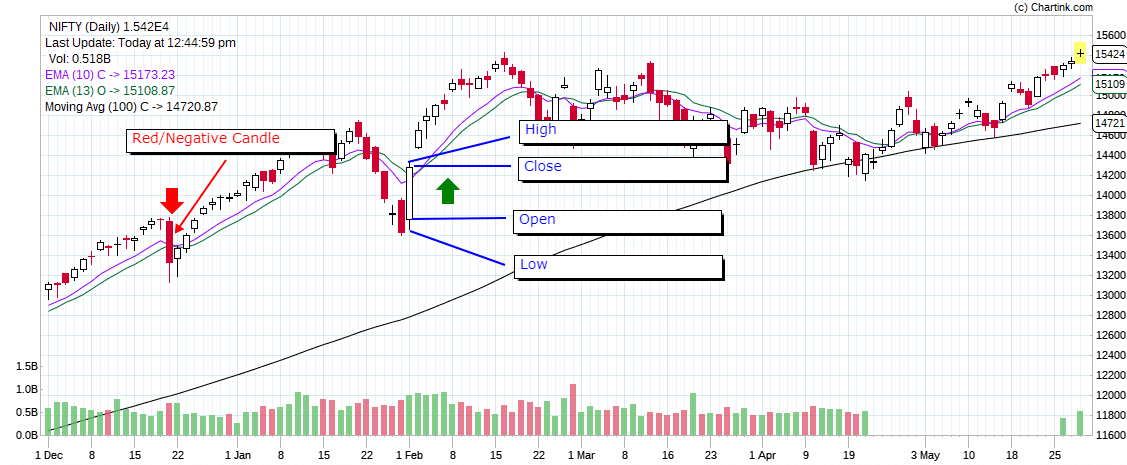
Candlesticks were first termed by the Japanese, which has all these indications:
The High, Low, open, and close of any particular day’s trade.
Candlesticks are either green are red in color. Both Red and Green candles have the same indications in the candlestick charts.
Green candlesticks: They open lower and end up going higher and close.
Red candlesticks: They open higher and end up going lower and close.
2) DOJI patterns:
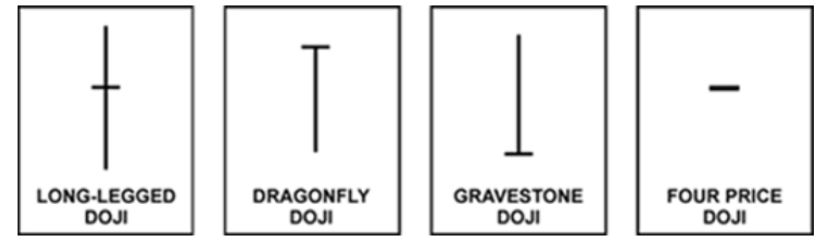
Doji is a candle without a body just a tail. It opens and closes near the same place.
What does a Doji Indicate?
Doji indicates that there is equal pressure from both sides and bulls and bears both cannot overpower each other.
Doji indicates that that is ambiguity in the market. When a Doji is formed, further candles indicate what happens to the market next.
3) Price Action Patterns:
a) Hammer and Hanging Man: 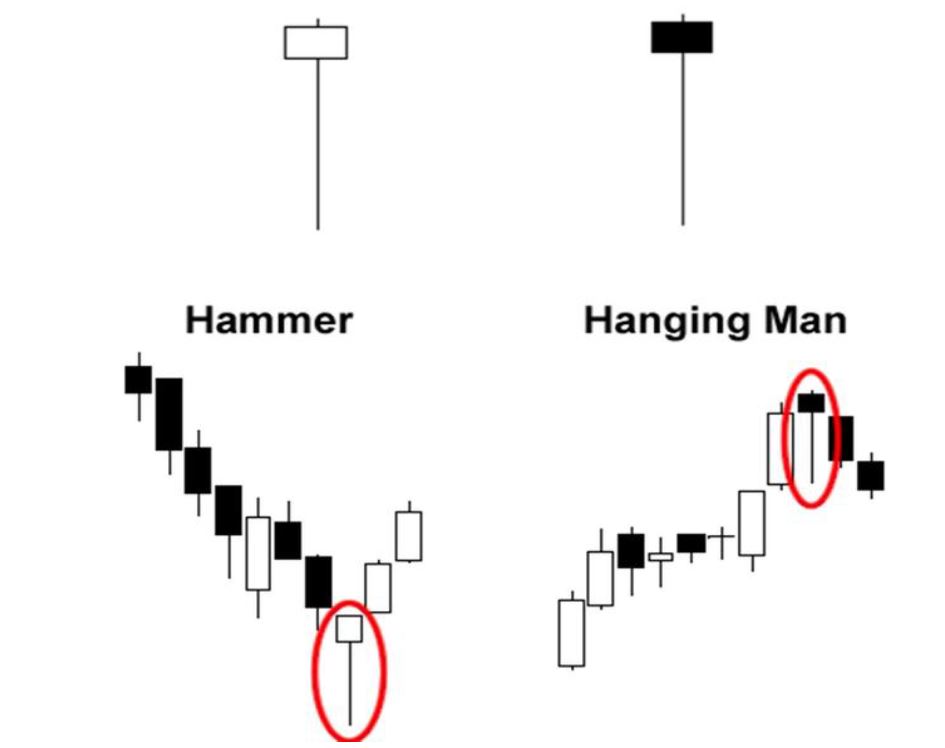 • The long shadow or wick is about two or three times the size of the real body.
• Little or no upper shadow or wick.
• The real body is in the upper third of the trading range.
Hammer indicates a bullish pattern when occurred in the bearish market territory. If a hammer pattern occurs in the uptrend market, it means the continuation of the trend.
Hanging Man indicates a bearish pattern when occurred in the bullish market territory. If the hanging man occurs in the downtrend market, it means the continuation of the trend.
b) ENGULFING CANDLES:
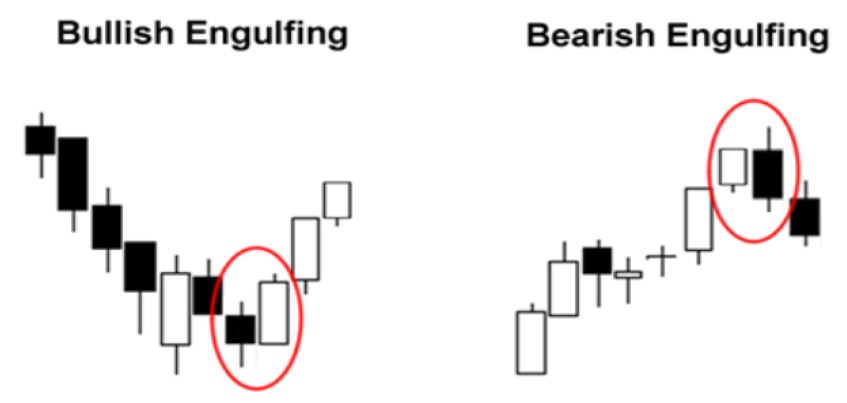
- We only look at the bodies to determine Engulfing candles.
- It is where the body of the current candle completely swallows the body of the previous candles
BULLISH ENGULFING CANDLES:
- Bullish engulfing usually means reversal to the upside.
- The bullish engulfing pattern is a two candlestick pattern that signals a strong up move may be occuring soon. It happens when a bearish candle is immediately followed by a larger bullish candle.
BEARISH ENGULFING CANDLES:
- Bearish engulfing usually means reversal to the downside.
- The bearish engulfing pattern is the opposite of the bullish pattern.
- This type of pattern occurs when the bullish candle is immediately followed by a bearish candle that completely “engulfs” it.
- This means that a strong move down could happen.
3) Price Action Patterns:
a) Head and Shoulders Pattern:
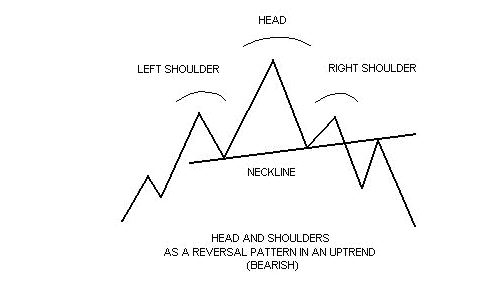
The Head and Shoulder chart means that the upside is capped and the reversal is happening.
The Head and Shoulder pattern has a neckline that determines the level of resistance.
If Neckline resistance is not broken then the market is poised for a downturn.
It is quite possible that the neckline resistance can really up or down depending on the particular Head and Shoulder pattern.
The head and shoulders pattern is only complete when the neckline resistance is not broken and the markets tend to go down.
b) Inverted Head and Shoulder Pattern:

The Inverted Head and Shoulder pattern is a positive pattern that tends to move or propel the market higher.
Once the neckline resistance is broken on the right side of the inverted Head and Shoulder, the positivity is proven.
Neckline acts as your support in this case where the upside was capped by sellers.
Usually, in the inverted head and shoulders pattern, the right shoulder shows higher volume compared to the left shoulder.
c) Rounding Bottom:
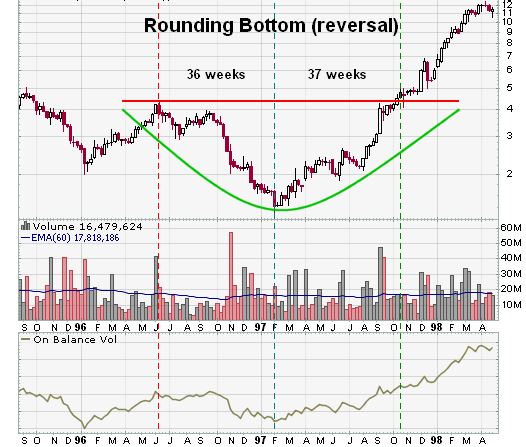 Chart Source: Stockcharts
The rounding bottom candlestick pattern shows that the stock is poised for an up move and is a bullish pattern.
Usually, the rounding bottom pattern occurs when the downside is capped and the stock is moving upside.
The rounding bottom pattern is very easy to notice on the technical stock chart analysis.
The rounding bottom pattern can be used in intraday for the delivery of stock charts.
.
4) Different Indicators:
There are lots of indicators which make the cut to the oscar shows.
But I’ve discussed all the important indicators in how to predict bank nifty trend.
Those indicators are very important. Anyways, I’ll name them for you here as well.
- EMAs
- SMA
- Trend Line
- Fast Stochastic (Optional)
- Slow Stochastic (Optional)
- MACD
As already mentioned all these indicators are in full-term explained in the bank nifty trend post. Check that out.
5) Strategy to Trade:
Fibonacci Retracements are the best strategy to trade for newbies.
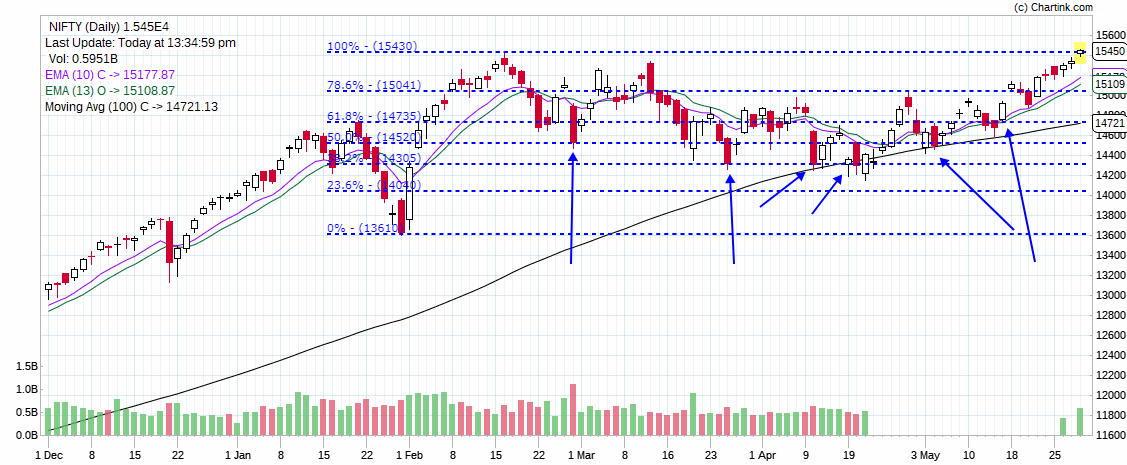
Fibonacci Retracement is the best of the strategies to trade.
When the market returns to the Fib levels, look for signs of reversal, once the reversal is confirmed buy them or sell them as per the support or resistance it poses.
You may see that Fibonacci retracement has held on to the support levels multiple times. So it is with the resistance part.
b) EMA Crossovers: 

EMA crossover is the best strategy to trade in the technical analysis field.
I’ve given a full blown presentation of EMA crossover in the Nifty Trend Calculator Method. Go check it out.
When the 10 Day EMA gives a positive crossover above 13 Day EMA, then buy the stock or the index.
When the 10 Day EMA gives a negative crossover below 13 Day EMA, then sell the stock or the index.
I’ve got a full-blown class of Nifty Intraday Options Training where I teach 4 Full-time strategies with 10 Years of backtesting.
That being said, I’ve covered a lot of stuff in this blog post.
If you found it helpful, don’t forget to share it with others. Comment below what you thought. I’d love to interact to my readers.
Having said that, I would say HAPPY TRADING AND HAPPY MONEY MAKING!