
Listen closely, comparing the pe ratio vs peg ratio is the definitive milestone that separates amateur stock screeners from seasoned Dalal Street portfolio managers. In real trading desks, we never evaluate a corporate valuation multiple in a vacuum. Instead, we always benchmark price-to-earnings multiples against verifiable forward earnings compounding speed.
Here is why conventional equity screeners frequently deceive beginner investors. A stock trading at a seemingly bargain price-to-earnings ratio of 8 might look exceptionally cheap on surface metrics. However, if the underlying company is experiencing negative profit growth, that cheap stock is actually an expensive value trap heading for prolonged wealth destruction.
Investors looking to master institutional balance sheet analysis should enroll in our structured Basics of Stock Market Course to gain practical financial modeling skills. Additionally, studying our best-selling investment guide Kaliyiri Share Market Book will teach you how to identify high-growth multibagger stocks with disciplined entry rules.
Mathematical Foundations: Price to Earnings vs Price/Earnings to Growth
Let us break down the exact mathematical mechanics that govern both valuation metrics on Indian equity exchanges. Understanding these foundational equations allows you to evaluate any corporate earnings release with total clarity.
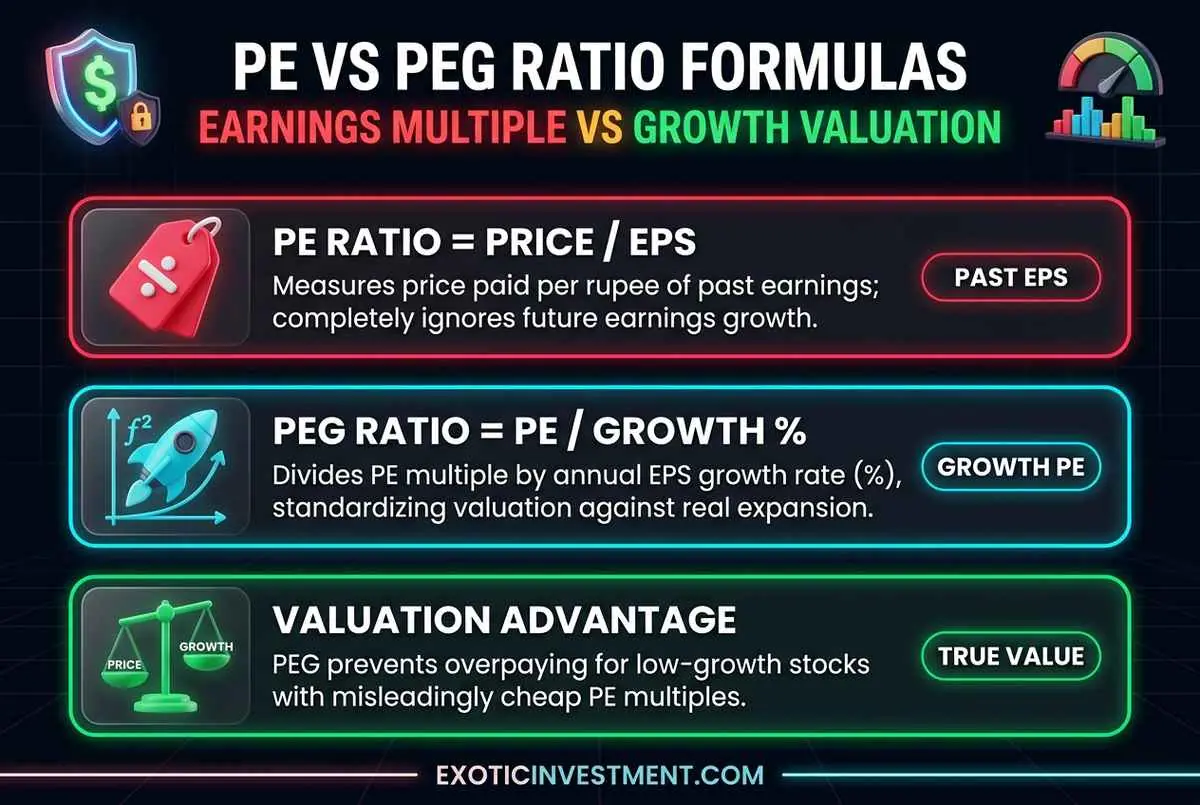
First, the traditional Price to Earnings (PE) ratio divides the current market price of a single share by its trailing twelve-month Earnings Per Share (EPS). In practical terms, this multiple illustrates how many rupees investors are willing to pay today for each rupee of net annual profit generated by the business.
Second, the Price/Earnings to Growth (PEG) ratio, popularized by legendary Wall Street fund manager Peter Lynch, bridges the critical gap left by the basic PE ratio. Specifically, the PEG ratio divides the company’s PE multiple by its expected annual percentage earnings growth rate.
Third, this mathematical adjustment normalizes valuations across companies expanding at vastly different speeds. For example, a high-flying tech company trading at a PE of 45 that compounds earnings at 50% annually has a PEG ratio of 0.90. In contrast, a stagnant utility firm trading at 15 PE with a 3% annual growth rate carries a bloated PEG ratio of 5.00.
Before purchasing high-growth stocks, evaluate your trade execution expenses and statutory exchange levies with our free Indian stock brokerage calculator. Disciplined market participants also track global capital liquidity and tokenized venture assets on eMintage portfolio tracker to evaluate emerging risk appetite.
Why Basic PE Ratio Misleads Retail Investors on Dalal Street
Relying solely on trailing PE ratios is one of the most widespread psychological traps in retail investing. Without factoring in growth trajectories and balance sheet quality, simple screeners lead investors directly into severe capital traps.

Consider the classic cheap value trap. Cyclical businesses such as steel producers, sugar mills, and commodity chemical firms often report peak profits at the top of an economic cycle, making their trailing PE ratios look deceptively tiny. When global commodity cycles reverse, profits collapse overnight, and that cheap 6 PE multiple suddenly balloons into an expensive 40 PE.
Conversely, the high PE illusion causes retail traders to prematurely exit market leaders. Outstanding Indian compounding champions like Titan, Asian Paints, and Trent have traded at seemingly astronomical PE multiples exceeding 60 to 80 for decades. Because these franchise businesses reinvest capital at 25%+ return on capital employed (ROCE), their compounding growth consistently validates their premium multiples.
In addition, one-off accounting distortions frequently skew trailing EPS numbers. An exceptional gain from selling factory land or subsidiary equity artificially inflates net profit for a single quarter, creating an optical illusion of cheapness that disappears in subsequent reports.
Comparative Valuation Matrix: PE Ratio vs PEG Ratio
To assist your fundamental screening process, our research desk has structured a comprehensive side-by-side comparison illustrating how both metrics behave across diverse market conditions.
| Valuation Parameter | Price to Earnings (PE) Ratio | Price/Earnings to Growth (PEG) Ratio |
|---|---|---|
| Primary Formula | Current Stock Price ÷ EPS | PE Ratio ÷ Annual EPS Growth Rate (%) |
| Growth Factor | Completely ignores future earnings growth | Explicitly links multiple to earnings velocity |
| Best Applied To | Mature, stable dividend cash cows | High-growth mid-caps, tech & consumer firms |
| Optimal Target Zone | Relative to 5-year industry median | PEG < 1.0 indicates strong margin of safety |
When engineering a multi-decade family wealth creation plan, steady disciplined investing beats speculative timing every single time. Use our free SIP return calculator to map out how consistent compounding builds multi-crore retirement reserves.
Peter Lynch PEG Ratio Benchmarks for Indian Equities
Adopting Peter Lynch’s institutional framework allows you to establish strict quality benchmarks for classifying prospective investments across Dalal Street.
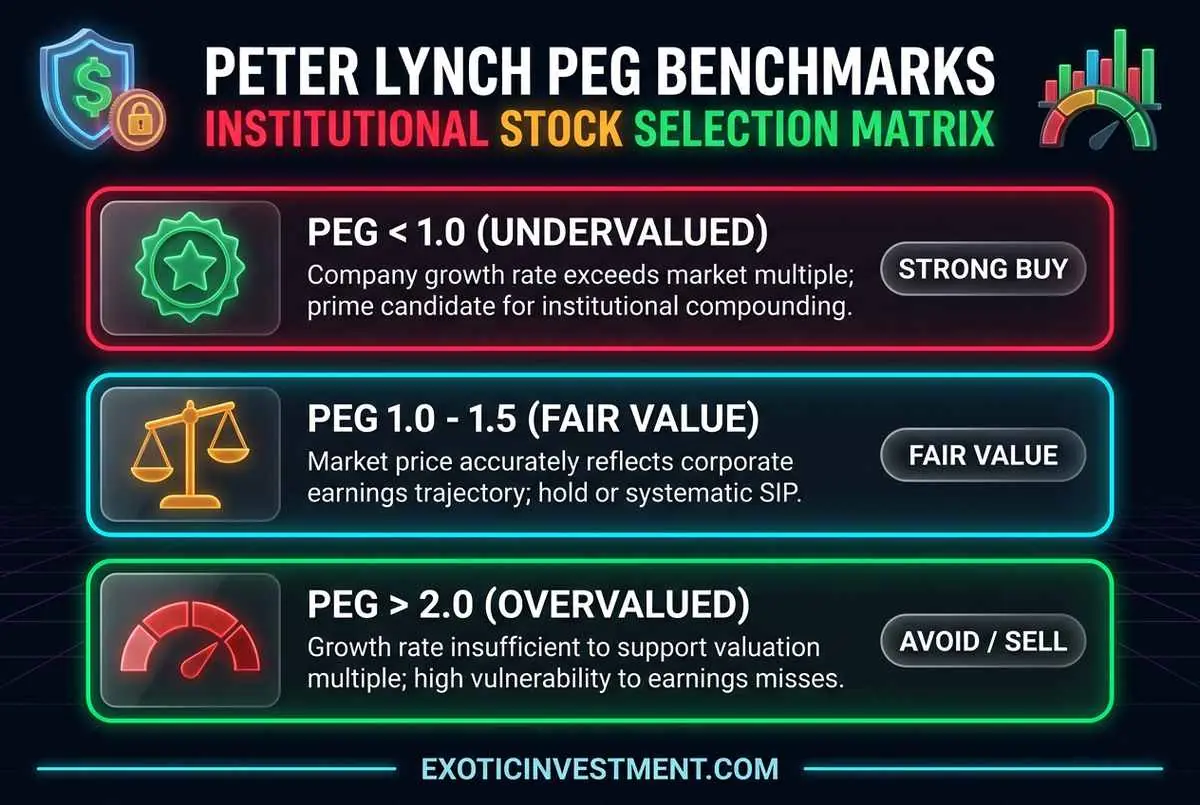
First, a PEG ratio below 1.0 signifies an undervalued equity with a generous margin of safety. In this sweet spot, the company’s compounding rate outstrips the market multiple assigned to it. Growth investors accumulate shares aggressively in this zone because forward profit growth will naturally pull the share price upward.
Second, a PEG ratio between 1.0 and 1.5 represents fair value. Leading blue-chip companies inside the Nifty 50 index frequently reside in this corridor during normalized economic phases. These steady franchise compounders generate predictable double-digit returns without subjecting portfolios to wild valuation crashes.
Third, a PEG ratio exceeding 2.0 flags an overvalued counter priced for absolute perfection. When a stock trades at a PEG above 2.0, even a minor quarterly earnings slowdown or margin contraction can trigger severe institutional de-rating, leading to sharp 30% to 50% price corrections.
Before executing fresh equity allocations, always simulate profit targets and exit taxation using our stock profit calculator. Maintaining strict valuation thresholds guarantees enduring portfolio outperformance.
Actionable Fundamental Checklist for Indian Stock Pickers
To upgrade your stock selection process and avoid costly valuation traps, implement these core principles on every candidate stock:
- Calculate 3-Year Forward CAGR: Never use a single quarter’s abnormal profit spike to compute your PEG ratio; utilize 3-year historical and forward projected earnings CAGR.
- Verify Operating Cash Flow Conversion: Confirm that reported net profits actually convert into operating cash flows. If cash flow lags EPS, the PE ratio is artificial.
- Check Return on Capital Employed (ROCE): Companies commanding high PE multiples must demonstrate sustainable ROCE exceeding 20% to justify their valuation premium.
- Avoid Cyclical Traps at Single-Digit PE: Never buy commodity producers solely because their trailing PE is low; wait for cycle troughs when PE multiples are high but earnings are poised to rebound.
Frequently Asked Questions About PE and PEG Ratios
Can the PEG ratio be negative, and what does it mean?
Yes, a PEG ratio becomes negative when a company reports negative net profits (negative EPS) or experiencing contracting earnings growth. A negative PEG ratio indicates fundamental deterioration and warns investors to avoid the counter.
Is Trailing PE or Forward PE better when calculating the PEG ratio?
Forward PE combined with expected 3-year projected earnings CAGR provides a superior indicator because stock markets trade on future earnings potential rather than past performance. However, always ensure analyst estimates are conservative.
Why do banking and NBFC stocks rarely use the PEG ratio?
Financial institutions carry high balance sheet debt as their core operating inventory. Therefore, institutional analysts evaluate banks and NBFCs using Price to Book Value (P/BV) and Return on Assets (ROA) rather than PEG ratios.
What is a good PEG ratio for small-cap stocks in India?
For high-potential small caps, a PEG ratio between 0.6 and 1.0 represents an exceptional investment opportunity, offering high earnings growth accompanied by a healthy valuation safety buffer.