Track real-time Put Call Ratio (PCR) open interest, volume shifts, max pain levels, and institutional contrarian sentiment gauges across NSE index derivatives.
| Strike | Call OI (Resistance) | Put OI (Support) | Bias |
|---|
Get instant Telegram & WhatsApp alerts when PCR crosses 1.45 (Overbought Reversal) or dips below 0.65 (Contrarian Bounce).
Upgrade to Pro Desk — ₹2,739/yrHow to Trade Using PCR in 4 Steps
Select Target Index
Switch between NIFTY 50, BANK NIFTY, and FIN NIFTY to load live contract open interest.
Examine the PCR Gauge
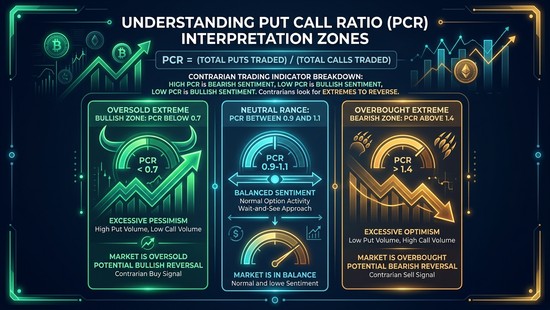
Evaluate whether current PCR indicates bullish accumulation (>1.1), neutral balance (0.9-1.1), or contrarian extremes.
Analyze Strike Concentrations
Identify major put writing floors (support) and call writing ceilings (resistance) around the Max Pain level.
Spot Contrarian Reversals
When PCR reaches overbought (>1.45) or oversold (<0.65) zones, prepare for impending mean-reverting trend reversals.
Understanding the Put Call Ratio (PCR): The Smart Money Sentiment Barometer
The Put Call Ratio (PCR) is one of the most widely used derivative sentiment indicators on the National Stock Exchange (NSE). Calculated by dividing total open interest of Put options by total open interest of Call options (PCR = Put OI / Call OI), it reveals whether options writers (institutional smart money) are building bullish or bearish positioning.
1. Why Writers Drive the Direction
In the derivatives market, options buying requires small capital, while writing (selling) options requires substantial margin capital (typically ₹1.2 Lakh+ per lot). Because institutions and hedge funds are the primary sellers of options, high Put OI represents aggressive institutional underwriting betting the index will stay above that floor.
2. PCR as a Contrarian Indicator
While a PCR between 1.0 and 1.3 confirms a healthy bull trend, extreme values act as contrarian turning points. When PCR climbs above 1.50, market sentiment becomes overly euphoric and vulnerable to long unwinding. Conversely, when PCR plummets below 0.65, panic selling peaks, often sparking violent short-covering rallies.
3. Open Interest PCR vs Volume PCR
OI PCR measures overnight structural positioning held by institutions. Volume PCR reflects fast intraday order flow. Comparing divergence between Volume PCR and OI PCR helps traders detect intraday traps before market close.
📋 Regulatory References & Data Sources
- SEBI risk management framework guidelines
- Reserve Bank of India (RBI) financial market benchmark data
- Income Tax Department of India rules & circulars
Disclaimer: This calculator is for educational and planning purposes only. It does not constitute financial advice. Consult a SEBI-registered investment advisor for personalised guidance. Tax rules are updated as per the latest Finance Act — verify with a qualified CA before filing.
Explore Related Derivative Terminals
NSE Option Chain Terminal
Live real-time Greeks, IV crush tracker, and Multi-strike OI analysis for Nifty and Bank Nifty.
Black-Scholes Greeks Calculator
Compute Delta, Gamma, Theta, Vega, and Rho for European index and stock options.
Nifty Trend Today Dashboard
Multi-timeframe technical pivot levels, ATR ranges, and institutional market breadth signals.