
Discovering who is operator in stock market networks is essential for every Indian retail trader seeking to protect hard-earned capital from artificial price manipulation. In financial parlance, stock market operators are well-funded syndicates, high-net-worth speculators, or broker rings who collude to control floating supplies of illiquid shares. Consequently, these cartels engineer sharp price rallies and sudden crashes to exploit uninformed retail participants.
Every active trader encounters specialized terminology when analyzing order books and sudden volume surges across NSE and BSE counters. By decoding operator tactics, bear syndicates, and short selling vocabulary, you can easily distinguish genuine institutional accumulation from speculative traps. In this guide, we break down circular trading mechanics, SEBI market surveillance actions, short squeeze dynamics, and risk protection rules.
Who is Operator in Stock Market? Modus Operandi & Cartels
To define plainly, an operator is an individual or informal syndicate possessing deep capital resources who deliberately manipulates stock prices for illicit personal profit. These syndicates typically target micro-cap and small-cap companies where the public shareholding float is limited. Because floating stock is scarce, an operator needs relatively modest capital to corner shares and dictate price movements.
In addition, market operators frequently collaborate with unethical company promoters who desire artificially inflated share valuations. By manufacturing continuous upper circuits, the cartel generates widespread retail euphoria on social media channels. You can model your portfolio risk limits and simulate trade scenarios using our free stop loss calculator.
| Market Force | Capital Horizon | Primary Motivation | Regulatory Status |
|---|---|---|---|
| Genuine Institutions (FII / DII) | Multi-Year Compounding | Fundamental business value and dividend growth | Strictly Regulated by SEBI |
| Company Promoters | Permanent / Strategic | Enterprise expansion and controlling ownership | Subject to Insider Trading Norms |
| Market Operators | Short-Term (Weeks / Months) | Pump and dump profits extracted from retail FOMO | Illegal (Violates SEBI PFUTP) |
| Bear Cartels | Short-Term (Intraday / Weekly) | Coordinated short hammering and panic dumps | Surveilled under GSM / ASM |
Therefore, recognizing these distinct market participants separates analytical investors from unsuspecting victims. When an operator triggers a price run, technical charts appear exceptionally bullish to retail screeners. In reality, the entire move is engineered to create sufficient liquidity for the operator to exit at the top.

Illustration: The Complete Market Participant Ecosystem Across Indian Stock Exchanges. In addition, monitor institutional delivery volumes.
The Anatomy of an Operator Trap: Circular Trading & Spoofing
Understanding how operators engineer price traps helps you protect your trading capital from devastating drawdowns. In particular, rogue operators execute their schemes through three coordinated phases:
First, during the Accumulation Phase, the syndicate quietly buys up free-floating shares over several weeks without causing price spikes. They divide buy orders across multiple dummy trading accounts and related entities. Consequently, retail screeners fail to detect unusual block purchases during this covert buildup.
Second, during the Pump and Circular Trading Phase, the syndicate passes shares back and forth among internal accounts at progressively higher prices. This creates massive artificial turnover and causes the stock to lock into upper circuits daily. In addition, paid social media channels and WhatsApp groups begin circulating sensational rumors about bogus corporate acquisitions.
Finally, during the Distribution Phase, retail participants rush to buy shares fearing they will miss out on a multi-bagger rally. The operator dumps accumulated holdings directly into waiting retail buy queues at peak prices. Once the syndicate completes distribution, the stock locks into consecutive lower circuits, trapping retail buyers with zero exit liquidity.

Illustration: Anatomy of an Operator Manipulation Cycle from Accumulation to Distribution. In addition, verify delivery percentage ratios.
Core Short Selling Terms Every Serious Trader Must Master
To trade through volatile market environments safely, traders must master fundamental short selling terminology used on professional dealing desks. In addition, understanding these specialized terms prevents costly mistakes when executing high-speed bearish orders.
First, short covering occurs when traders with open bearish positions buy shares back in the open market to lock in profit or close trades. When numerous short sellers cover simultaneously, that sudden cluster of market buy orders triggers an explosive upward rally. You can compute trading breakeven points across broker platforms using our free Indian stock brokerage calculator.
Second, a short squeeze is a violent price spike caused by unexpected positive corporate developments or institutional buying. As share prices rally past key resistance levels, trapped short sellers face severe margin calls from brokers. Consequently, their forced automated buy-backs accelerate the upward surge, creating painful losses for bearish speculators.
Third, the Securities Lending and Borrowing (SLB) mechanism enables institutional participants to borrow physical shares for multi-week short positions. Under SEBI regulations, retail cash shorting overnight is strictly barred. You can track your overall multi-asset investments and short-side hedges using the eMintage portfolio tracker.
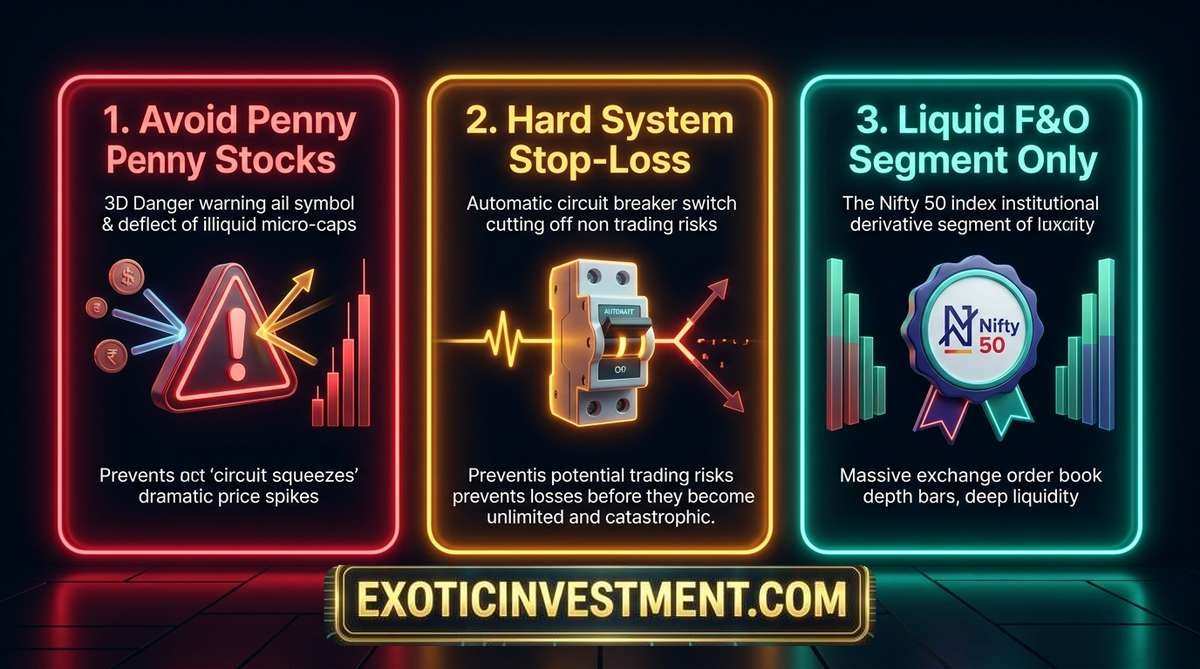
Illustration: Essential Risk Control Rules for Retail Traders Managing Bearish Volatility. In addition, never trade without protective stops.
How SEBI Surveillance Protects Retail Investors from Operators
The Securities and Exchange Board of India (SEBI) deploys cutting-edge algorithm surveillance engines to detect market manipulation in real time. Specifically, SEBI and stock exchanges employ Graded Surveillance Measures (GSM) and Additional Surveillance Measures (ASM) to flag suspicious trading behavior.
When a counter exhibits abnormal price-to-earnings expansion or suspicious volume concentration, the exchange shifts it into the Trade-for-Trade (T2T) segment. Consequently, intraday margin trading is completely disabled, and buyers must deposit 100% upfront cash. You can review trading restrictions in our detailed what is BE in share market guide.
In addition, calculate your exact statutory fees and taxes using our updated what is STT in share market guide. To model long-term systematic compounding instead of chasing manipulated penny stocks, deploy our free SIP wealth calculator.
In addition, evaluating corporate corporate disclosures and promoter share pledges protects your capital from catastrophic accounting fraud. In fact, companies where promoters have pledged more than 20% of their equity holdings face heightened operator vulnerability. Therefore, auditing annual balance sheets and quarterly cash flows is the ultimate defense for retail investors.
To master institutional chart reading and price action, study our foundational Basics of Stock Market Course. In addition, read our bestselling Kaliyiri Share Market Book, and elevate your strategic trading skills through the MultiBagger Plus Pro Annual Subscription.
💡 Frequently Asked Questions on Operators in Stock Market
Who is called an operator in the share market?
An operator is a high-net-worth individual or syndicate that uses substantial capital to artificially manipulate illiquid stock prices. These syndicates create false volumes to trap retail traders into pump-and-dump schemes.
Is stock market operator manipulation legal in India?
No, operator manipulation and circular trading are strictly illegal under SEBI Prohibition of Fraudulent and Unfair Trade Practices regulations. SEBI routinely bans rogue operators and impounds illicit profits.
How can a retail trader identify operator-driven stocks?
Operator-driven stocks typically feature low equity float, consecutive upper circuits on negligible volumes, sensational social media rumors, and weak corporate financial fundamentals. Genuine institutional buying shows steady volume without artificial circuit locks.
What should you do if you are trapped in an operator stock?
If you find yourself trapped in a stock hitting lower circuits, place a pre-market sell order at 9:00 AM every morning. Never average down or deploy fresh money into a falling operator-manipulated counter.
