EPS Calculator Online
Find the earnings per share of any Indian stock in seconds. Enter net profit and total shares, and see instant EPS with a PE snapshot.
EPS Calculator
EPS Calculator
₹5,00,00,000
20.0x
₹—
₹—
🔗
Also Try These Calculators
📈
PE Ratio Calculator
Is the stock cheap or expensive? Check PE vs sector avg →
🎯
Reverse CAGR Calculator
Find the CAGR your portfolio needs to hit any goal →
💵
Lumpsum Investment Calculator
Project one-time investment returns at any CAGR →
📉
Beta Calculator — Indian Stocks
Measure a stock’s risk vs Nifty 50 index →
💹
Rate of Return Calculator
Calculate actual % returns on any stock investment →
🧮
Stock Market Average Calculator
Average down your cost basis across multiple buys →
Unlock Pro Analytics
Upgrade to the Premium Plan to unlock year-by-year EPS projections, LTCG-adjusted returns, dividend-per-share estimates, and the fair-value PE matrix used by pro investors.
(function() {
var isPro = document.getElementById(‘eps-app’).getAttribute(‘data-is-pro’) === ‘true’;
var isLoggedIn = true;
var currentTab = ‘basic’;
var sel = function(id) { return document.getElementById(id); };
var heroLbl=sel(‘eps-hero-lbl’), heroVal=sel(‘eps-hero-val’);
var insight=sel(‘eps-insight’);
var valProfit=sel(‘eps-val-profit’), valShares=sel(‘eps-val-shares’), valPe=sel(‘eps-val-pe’);
var valProj=sel(‘eps-val-proj’), valGain=sel(‘eps-val-gain’), valDouble=sel(‘eps-val-double’);
var valPro1=sel(‘eps-val-pro1’), valPro2=sel(‘eps-val-pro2’);
var waLink=sel(‘eps-wa-link’), saveBtn=sel(‘eps-save-btn’);
function fmtRs(n) { return ‘u20b9’ + n.toLocaleString(‘en-IN’, {maximumFractionDigits:2}); }
function fmtRsNoDec(n) { return ‘u20b9’ + n.toLocaleString(‘en-IN’, {maximumFractionDigits:0}); }
function fmtX(n) { return n.toFixed(1) + ‘x’; }
function bindSlider(slId, inpId) {
var sl = sel(slId), inp = sel(inpId);
if (!sl || !inp) return;
sl.addEventListener(‘input’, function() { inp.value = sl.value; epsRun(); });
inp.addEventListener(‘input’, function() {
var v = parseFloat(inp.value) || 0;
v = Math.min(Math.max(v, parseFloat(sl.min)), parseFloat(sl.max));
sl.value = v; epsRun();
});
}
function runBasic() {
var profit = parseFloat(sel(‘basic-profit-inp’).value) || 0;
var shares = parseFloat(sel(‘basic-shares-inp’).value) || 1;
var price = parseFloat(sel(‘basic-price-inp’).value) || 1;
var eps = profit / shares;
var pe = eps > 0 ? (price / eps) : 0;
var yield_pct = price > 0 ? (eps / price * 100) : 0;
heroLbl.innerText = ‘Earnings Per Share’; heroVal.innerText = fmtRs(eps);
valProfit.innerText = fmtRsNoDec(profit);
valShares.innerText = shares.toLocaleString(‘en-IN’);
valPe.innerText = fmtX(pe);
if (isPro) {
// Pro calculations: 12.5% LTCG above 1.25L exemption, post-tax estimate
var ltcg_eff = eps > 0 ? (eps * 0.875) : 0; // simple 12.5% tax reduction
valPro1.innerText = fmtRs(ltcg_eff);
valPro2.innerText = fmtRs(eps * 0.70); // 30% dividend tax bracket view
}
var m = eps >= 20 ? ‘💡 Strong EPS! Each share generates ‘ + fmtRs(eps) + ‘ of profit.’ : eps >= 5 ? ‘💡 Decent EPS at ‘ + fmtRs(eps) + ‘ per share.’ : eps > 0 ? ‘💡 Low EPS of ‘ + fmtRs(eps) + ‘. Watch for growth.’ : ‘💡 Negative EPS means losses.’;
insight.innerText = m + ‘ At share price ‘ + fmtRs(price) + ‘, this stock has an implied PE of ‘ + fmtX(pe) + ‘ and earnings yield of ‘ + yield_pct.toFixed(2) + ‘%.’;
waLink.href = ‘https://api.whatsapp.com/send?text=’ + encodeURIComponent(‘📊 EPS Calculator OnlinenNet Profit: ‘ + fmtRsNoDec(profit) + ‘nOutstanding Shares: ‘ + shares.toLocaleString(‘en-IN’) + ‘nEPS: ‘ + fmtRs(eps) + ‘nPE (at ‘ + fmtRs(price) + ‘): ‘ + fmtX(pe) + ‘nnCalculated via exoticinvestment.com/eps-calculator-online/’);
}
function runGrowth() {
var cur = parseFloat(sel(‘growth-cur-inp’).value) || 0;
var rate = parseFloat(sel(‘growth-rate-inp’).value) || 0;
var yrs = parseFloat(sel(‘growth-yrs-inp’).value) || 1;
var proj = cur * Math.pow(1 + (rate/100), yrs);
var gain = cur > 0 ? ((proj – cur) / cur * 100) : 0;
var double_yrs = rate > 0 ? (72 / rate) : 999;
heroLbl.innerText = ‘Projected EPS After ‘ + yrs + ‘ Years’; heroVal.innerText = fmtRs(proj);
valProj.innerText = fmtRs(proj);
valGain.innerText = ‘+’ + Math.round(gain) + ‘%’;
valDouble.innerText = double_yrs 0 ? (price / proj) : 0;
valPro1.innerText = fmtX(implied_pe) + ‘ PE’;
valPro2.innerText = fmtRs(proj * 0.875) + ‘ (Post-Tax)’;
}
insight.innerText = ‘🚀 At expected ‘ + rate + ‘% growth rate, your current EPS of ‘ + fmtRs(cur) + ‘ will grow to ‘ + fmtRs(proj) + ‘ in ‘ + yrs + ‘ years. Doubling time is ‘ + (double_yrs < 100 ? double_yrs.toFixed(1) : 'N/A') + ' years.';
waLink.href = 'https://api.whatsapp.com/send?text=' + encodeURIComponent('📈 EPS Growth ProjectionsnImplied Growth Rate: ' + rate + '%nHorizon: ' + yrs + ' YearsnProjected EPS: ' + fmtRs(proj) + ' (Growth: +' + Math.round(gain) + '%)nnCalculated via exoticinvestment.com/eps-calculator-online/');
}
window.epsRun = function() {
if (currentTab === 'basic') {
sel('eps-basic-legend').style.display = 'block';
sel('eps-growth-legend').style.display = 'none';
runBasic();
} else {
sel('eps-basic-legend').style.display = 'none';
sel('eps-growth-legend').style.display = 'block';
runGrowth();
}
};
function switchTab(t) {
currentTab = t;
['basic', 'growth'].forEach(function(x) {
sel('eps-tab-' + x + '-btn').classList.toggle('active', x === t);
});
epsRun();
}
sel('eps-tab-basic-btn').addEventListener('click', function(){ switchTab('basic'); });
sel('eps-tab-growth-btn').addEventListener('click', function(){ switchTab('growth'); });
bindSlider('basic-profit-sl', 'basic-profit-inp');
bindSlider('basic-shares-sl', 'basic-shares-inp');
bindSlider('basic-price-sl', 'basic-price-inp');
bindSlider('growth-cur-sl', 'growth-cur-inp');
bindSlider('growth-rate-sl', 'growth-rate-inp');
bindSlider('growth-yrs-sl', 'growth-yrs-inp');
window.epsCopyLink = function() {
var params = '?tab=' + currentTab;
if (currentTab === 'basic') {
params += '&profit=' + sel('basic-profit-inp').value + '&shares=' + sel('basic-shares-inp').value + '&price=' + sel('basic-price-inp').value;
} else {
params += '&cur=' + sel('growth-cur-inp').value + '&rate=' + sel('growth-rate-inp').value + '&yrs=' + sel('growth-yrs-inp').value;
}
var url = window.location.origin + window.location.pathname + params;
if (navigator.clipboard) {
navigator.clipboard.writeText(url).then(function(){ alert('Link copied!'); });
} else {
prompt('Copy this link:', url);
}
};
(function loadUrl(){
var p = new URLSearchParams(window.location.search);
var tab = p.get('tab');
if (tab === 'growth') {
if(p.get('cur')){ sel('growth-cur-inp').value=p.get('cur'); sel('growth-cur-sl').value=p.get('cur'); }
if(p.get('rate')){ sel('growth-rate-inp').value=p.get('rate'); sel('growth-rate-sl').value=p.get('rate'); }
if(p.get('yrs')){ sel('growth-yrs-inp').value=p.get('yrs'); sel('growth-yrs-sl').value=p.get('yrs'); }
switchTab('growth'); return;
}
if(p.get('profit')){ sel('basic-profit-inp').value=p.get('profit'); sel('basic-profit-sl').value=p.get('profit'); }
if(p.get('shares')){ sel('basic-shares-inp').value=p.get('shares'); sel('basic-shares-sl').value=p.get('shares'); }
if(p.get('price')){ sel('basic-price-inp').value=p.get('price'); sel('basic-price-sl').value=p.get('price'); }
})();
window.epsOpenPaywall = function(){ sel('eps-paywall').classList.add('open'); };
window.epsClosePaywall = function(){ sel('eps-paywall').classList.remove('open'); };
if(saveBtn){
saveBtn.addEventListener('click', function(){
if(!isLoggedIn){ window.open('https://exoticinvestment.com/checkout/?add-to-cart=4382','_blank'); return; }
this.innerText='SAVING…';
setTimeout(function(){saveBtn.innerText='u2705 STRATEGY SAVED!';},600);
setTimeout(function(){saveBtn.innerText='ud83dudcbe Save to Profile';},2500);
});
}
epsRun();
})();
⚡ How the EPS Calculator Online Works
Four quick steps. No sign-up needed. Here is the whole flow.
Choose Your EPS Mode
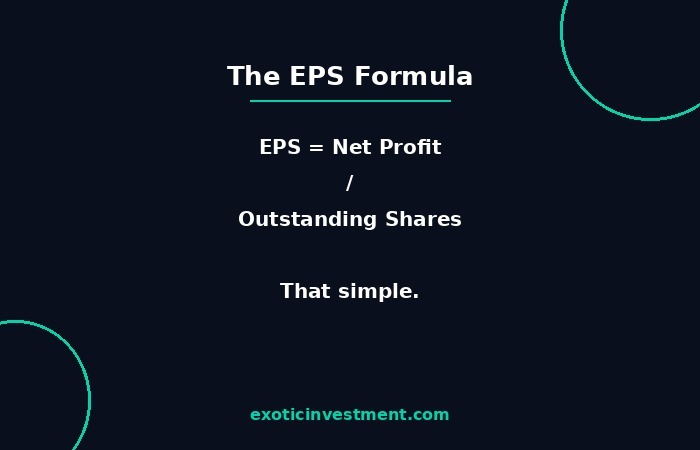
Pick Basic EPS to calculate earnings per share using net profit and outstanding shares, or switch to EPS Growth for compounding projections.
Enter Core Inputs
Input the net profit and outstanding shares (found on balance sheets). Slide or type to adjust values; outcomes recalculate dynamically.
Analyze the PE Snapshot
Add a target share price to view the implied PE ratio and earnings yield instantly. Compare vs industry standards on the spot.
Share or Save Your Growth Plan
Calculate your Rule of 72 doubling timeline, share the strategy via WhatsApp, or copy a direct pre-filled link to your clipboard.
Master the Stock Market: From Beginner to Pro
Learn fundamental analysis, balance sheet ratios, and EPS growth valuation by Ashok Kumar N Rao.