
What is flls meaning in share market?
Listen, boss. FII stands for Foreign Institutional Investor. These are big foreign money players like pension funds, mutual funds, insurance companies, and hedge funds from outside India. They park their cash in Indian stocks, bonds, and other instruments.
Here’s the thing. In 2014, SEBI changed the name. Now they are called FPI, which means Foreign Portfolio Investor. But every trader on the floor still says “FII” out of habit. You will hear it on TV, in newspapers, and in every trading group chat.
When you see headlines like “FIIs sold ₹5,000 crore today,” it means foreign investors pulled out that much money from the Indian market. That same headline could also say “FPIs bought ₹3,200 crore.” Both mean the exact same thing. No confusion.
Think of it this way. FIIs and FPIs are foreign whales swimming in our Indian market pond. When they dive deep to buy, the market goes up. When they sprint out to sell, the market takes a nosedive. That is why every Indian trader keeps a close eye on daily FII data.
These foreign investors usually move in large blocks. A single FII fund can trade millions of shares in a day. That means their actions create big volume spikes. Volume spikes matter because they tell you where the smart money is heading.
SEBI regulates FPI participation under strict rules. There is a ceiling limit too. Foreign ownership in any single Indian company cannot cross 24% without the board’s approval. This rule protects Indian companies from being taken over by foreign giants overnight.
Why flls meaning in share market Matters for Indian Stock Traders
Let’s keep it simple. Why should a small retail trader from Bengaluru or Indore care about what foreigners are doing? Honestly speaking, it matters a lot. Here’s why.
First, FII flows directly impact the Nifty and Sensex. When foreign money pours in, index levels climb. When they exit in a panic, indexes crash hard. Your portfolio feels this pain or joy whether you like it or not.
Second, FII selling often creates the best buying opportunities for patient traders. I have seen this many times. The market drops 2% in a day because FIIs are selling. Smart retail traders step in with their stop loss plans already set and buy quality stocks at discounted prices.
Third, currency movement ties directly to FII flows. Every dollar that enters India strengthens the rupee slightly. Every dollar that leaves weakens it. If you also trade Bitcoin or other crypto assets, you will notice FII data affects your cross-asset decisions too.
Fourth, sector rotation follows FII moves. Foreign investors typically favor large-cap banks, IT stocks, and FMCG companies. When you track which sectors FIIs are buying, you get a head start on where momentum is building. Check the stock profit calculator to estimate your potential returns before entering.
Fifth, FII data helps you understand market sentiment. Are foreigners bullish or bearish on India right now? Their monthly numbers give you that answer within seconds. Use the pivot point calculator alongside FII data for sharper entry and exit points.
Key Concepts Related to flls meaning in share market
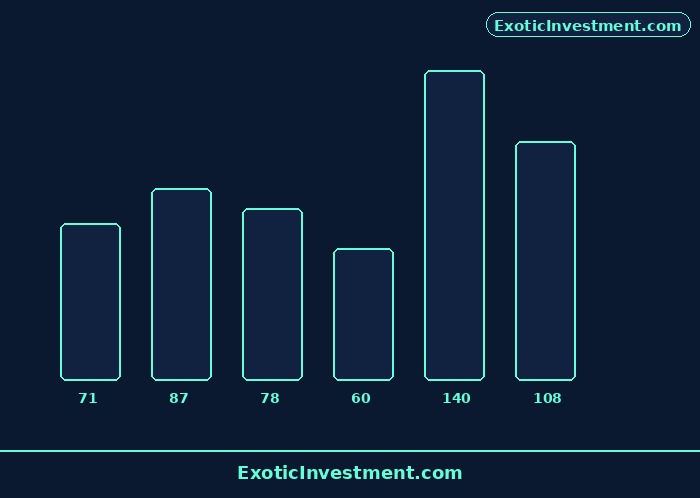
Illustration: Flls Meaning In Stock Market
Now let’s break down the key terms you must know cold. Trust me, these words show up everywhere in trading discussions.
DII vs FII: DII means Domestic Institutional Investor. These are Indian big players like LIC, SBI Mutual Fund, HDFC Mutual Fund, and life insurance companies. When FIIs sell, DIIs often buy to balance things out. Market watchers always compare both sides together.
FII/FPI Data Sources: You can find daily FII data on the National Securities Depository Limited website,NSEIndia.comand on the Bombay Stock Exchange website. Broker platforms like Zerodha and Upstox also display this data inside their apps.
G-Secs: Foreign investors do not just buy stocks. They also invest heavily in Government Securities. A large chunk of FII money sits in G-Secs because they offer steady returns with low risk. This bond buying also pushes yield rates down across the economy.
CDS Data: Check the Currency Derivatives data as well. When you see FII Long Book and Short Book figures, compare them side by side. If the Long Book is much bigger than the Short Book, foreigners are genuinely bullish. If Short exceeds Long, watch out for a correction ahead.
Block Deals: Sometimes big FII trades happen through block deals on the exchange. These are massive single transactions above a certain minimum value. Tracking block deal reports gives you an early signal of where smart foreign money is positioning itself.
Weightage Effect: Reliance, HDFC Bank, ICICI Bank, and Infosys carry huge weight in the Nifty 50. FII buying or selling of even one of these stocks can move the entire index by several points. Always check which heavyweights are driving the FII flow numbers.
Quarterly Portfolio Disclosure: Listed companies must disclose their top 10 shareholders every quarter. Check the annual report of any company you hold. You will see FII names like BlackRock, Vanguard, or legal entities connected to foreign funds sitting right there in the shareholding pattern.
If you want to learn these concepts properly, I strongly recommend going through the Basics of Stock Market Course. It covers everything from scratch in a very practical manner.
How to Apply This Knowledge Step by Step

Illustration: Flls Meaning In Share Market Diagram 2
Okay, now comes the practical part. How do you actually use FII data to make better trading decisions? Follow these steps every single day.
Step 1: Open your broker app first thing in the morning. Check the FII/FPI investment and divestment numbers for the previous trading session. Note whether the net figure is positive or negative. Keep a small notebook or Excel sheet for this habit.
Step 2: Check the CDS long and short book data. Compare the current week’s numbers with the previous four weeks. Is the trend improving or deteriorating? Consistent improvement over three weeks signals a healthy setup for the broader market.
Step 3: Look at which sectors are seeing the most FII buying. Use a profit calculator to estimate potential gains if you ride the FII-favored sector momentum. Do not chase blindly though.
Step 4: Set your stop loss levels strictly. FII-driven market moves can be sharp and fast. Without a stop loss, a sudden foreign selling day can wipe out weeks of profits in minutes. Always protect your capital first.
Step 5: If you are building a long-term portfolio, consider using an SIP calculator for systematic investment in FII-heavy mutual funds. Dollar-cost averaging reduces the risk of entering at a bad time during volatile foreign flow periods.
Step 6: Combine FII data with technical analysis. Use the pivot point calculator to identify key support and resistance levels. Then layer FII buying pressure data on top. When both signals agree, the trade has a much higher probability of working out.
Step 7: Keep a weekly review habit. Every Sunday, go through the entire week’s FII data. Look for patterns. Did the market fall only when FIIs sold heavily? Or did DIIs absorb the selling pressure? Understanding this pattern builds real trading intuition over time.
If you want structured learning with expert guidance, go through our recommended courses below.
Recommended Trading Courses & Premium Subscriptions:
- Options Buying Course in Kannada: Options Buying Course in Kannada.
- Technical Analysis in Kannada Course: Technical Analysis in Kannada Course.
- Kaliyiri Share Market Book: Kaliyiri Share Market Book.
- Basics of Stock Market Course: Basics of Stock Market Course.
- Multibagger Stocks Pro Subscription: Multibagger Stocks Pro Subscription (Checkout link: Buy Pro Subscription).
Common Mistakes and How to Avoid Them

Illustration: Flls Meaning In Share Market Diagram 3
Let me tell you something many new traders ignore at their own cost. Here are the biggest mistakes I have seen people make with FII data and how to fix each one.
Mistake 1: Overreacting to a single day’s data. One bad FII selling day does not mean the bull run is over. Markets move on many factors simultaneously. Do not panic-sell just because foreign investors dumped ₹3,000 crore in one session. Wait for at least three consecutive days of data before changing your strategy.
Mistake 2: Ignoring DII counter-flow. Never look at FII data in isolation. During the 2020 COVID crash, FIIs sold thousands of crores daily. But DIIs stepped in massively and absorbed most of that selling. The market fell but never collapsed. Track both numbers together as a pair.
Mistake 3: Chasing FII favorite stocks blindly. Just because Reliance or HDFC Bank is seeing FII buying does not mean you should jump in at the top. Use the profit calculator to assess your risk-reward ratio before entering. Wait for a pullback to support. Patience pays.
Mistake 4: Trading without a stop loss. This is the deadliest mistake. FII-driven volatility can gap down the open by 1% to 2%. If you have no stop loss, you will suffer a huge loss overnight. Always place your stop loss before entering any trade. No exceptions.
Mistake 5: Using margin credit without understanding FII impact. High margin credit plus FII selling equals account blowup. Many traders blew up their accounts in 2022 when the Fed raised rates and FIIs exited India aggressively. Keep your position sizing conservative. Never risk more than 2% of your capital on a single trade.
Mistake 6: Ignoring global cues entirely. FII flows depend heavily on US Federal Reserve policy, global risk appetite, and crude oil prices. If you only watch Indian FII data and ignore what is happening in America, you are trading with one eye closed. Stay informed on global markets too.
Advanced Trading Tips to Master This Topic
Ready to level up? These advanced tips separate serious traders from casual gamblers. Apply these with discipline and you will see a real difference in your results.
Tip 1: Build a weekly FII dashboard. Create a simple spreadsheet tracking weekly FII investment, divestment, CDS long-short difference, and net flow for the past six months. Add DII data beside it. Patterns will emerge that no YouTube video or Telegram tip can teach you. Real experience builds real edge.
Tip 2: Correlate FII data with Rupee movement. Download a crypto portfolio tracker and also monitor the USDINR currency pair. When FIIs are buying heavily and the rupee strengthens, it confirms genuine demand. Weak rupee with strong FII buying is a warning signal.
Tip 3: Watch the top 10 FII-held stocks list. Every listed company publishes its shareholder pattern. Maintain a watchlist of the top 20 stocks with the highest FII holding percentage. When FII buying increases in two or more of these stocks simultaneously, it is a strong sector-level signal.
Tip 4: Use pivot points during FII-driven volatility. On days when FII data shows heavy selling, the market opens with high volatility. Use the pivot point calculator to mark intraday support and resistance. Sell near resistance and buy near support until the foreign flow direction becomes clear.
Tip 5: Time your entries around monthly expiry. FII activity tends to increase during monthly option expiry weeks. Gamma exposure and rebalancing create extra volume. Use a profit calculator to size your positions carefully during these high-volatility windows. Avoid holding small-cap futures through expiry without tight risk control.
Tip 6: Run scenario analysis before major events. Before US Fed meetings, budget sessions, or RBI policy announcements, run through two or three market scenarios. What happens if FIIs sell ₹8,000 crore? What happens if they stay neutral? Have pre-planned trades ready for each scenario. Reacting slowly costs money.
Tip 7: Track FII fund flow into Gold ETFs. Yes, this is important. Some foreign investors rotate into gold ETFs during uncertain times. Rising gold inflows alongside falling stock FII buying often signals risk-off mood. It is a subtle but powerful leading indicator for market corrections.
For Kannada-speaking traders who want detailed guidance on options and technical analysis, the Options Buying Course in Kannada and the Technical Analysis in Kannada Course cover these advanced concepts in a very clear and practical way.
Final Summary
Let me bring everything together in a clean summary so you never forget the key points.
FII means Foreign Institutional Investor. They are now officially called FPI under SEBI rules. But everyone still uses the old term FII in daily conversation. These foreign money players move billions of rupees in and out of Indian markets every month.
Their buying pushes indices up. Their selling drags indices down. Your job as an Indian retail trader is to track their flows, understand the context, and make calculated decisions rather than emotional reactions.
Always combine FII data with DII data, global cues, and technical analysis. Never trade blindly based on one day’s numbers. Set your stop loss properly. Use pivot points for timing. Calculate your profit and loss before entering any trade.
Build the habit of checking FII data every single day. Within a few months, you will develop an instinct for how foreign money movements affect your portfolio. That instinct is priceless in this market.
Invest in proper education. Whether you choose the Kaliyiri Share Market Book, any of our Basics of Stock Market Course, or the Multibagger Stocks Pro Subscription, learning properly will save you from costly mistakes that beginners commonly make.
Remember, boss. The market rewards the prepared trader and punishes the impulsive one. Stay disciplined. Keep learning. Trade smart. And always, always protect your capital first. That is the real secret behind consistent success in the Indian stock market.
