
Tracking the excel realty share price attracts thousands of Indian retail traders hoping a sub-₹5 penny stock turns into a fast multibagger. Specifically, Excel Realty N Infra Ltd operates across IT-enabled services, infrastructure, and general trading. However, chasing single-digit penny stocks without a forensic risk audit often traps your capital.
Listen, boss, a ₹1 or ₹2 stock price creates a powerful illusion on Dalal Street. For instance, owning 50,000 shares feels exciting at first. However, consecutive lower circuits can lock every single buyer out of the order book. Therefore, separating real turnaround fundamentals from microcap hype protects your savings.
Let’s keep it simple: price alone never proves a stock is cheap. In fact, comparing microcaps against India’s six-figure compounders in highest share price in India proves why earnings quality beats low ticket prices every time. In addition, checking core execution terms under LTP, CMP, and ATP explained and sizing exposure via our position size calculator keeps speculative risk strictly contained.
Business Segments and Revenue Reality Behind Excel Realty N Infra
Excel Realty N Infra Limited operates across three broad segments: IT-enabled business process services, real estate infrastructure development, and general merchandise trading. Specifically, small-cap companies operating across unrelated verticals often report erratic quarterly revenue swings rather than steady compounding cash flows. Consequently, institutional mutual funds and FIIs almost completely avoid sub-₹200 crore microcaps with thin operating margins.

Illustration: Business Segments & Revenue Profile of Excel Realty N Infra Ltd.
In addition, evaluating earnings durability through PE ratio vs PEG ratio quickly exposes whether a microcap rally rests on real profit expansion or pure retail hype. Similarly, checking capital reserves under securities premium account rules clarifies whether balance sheet equity came from operating profits or repeated equity dilution.
Forensic Penny Risk Audit: Circuits, Promoter Stake, and Surveillance
Before placing a single rupee into any sub-₹10 counter, run a strict institutional risk checklist. First, review the promoter shareholding percentage and public float distribution. Specifically, low promoter ownership paired with retail crowding creates heavy supply on every bounce. In fact, learning classic microcap red flags in what are penny stocks in India saves beginners lakhs in drawdowns.
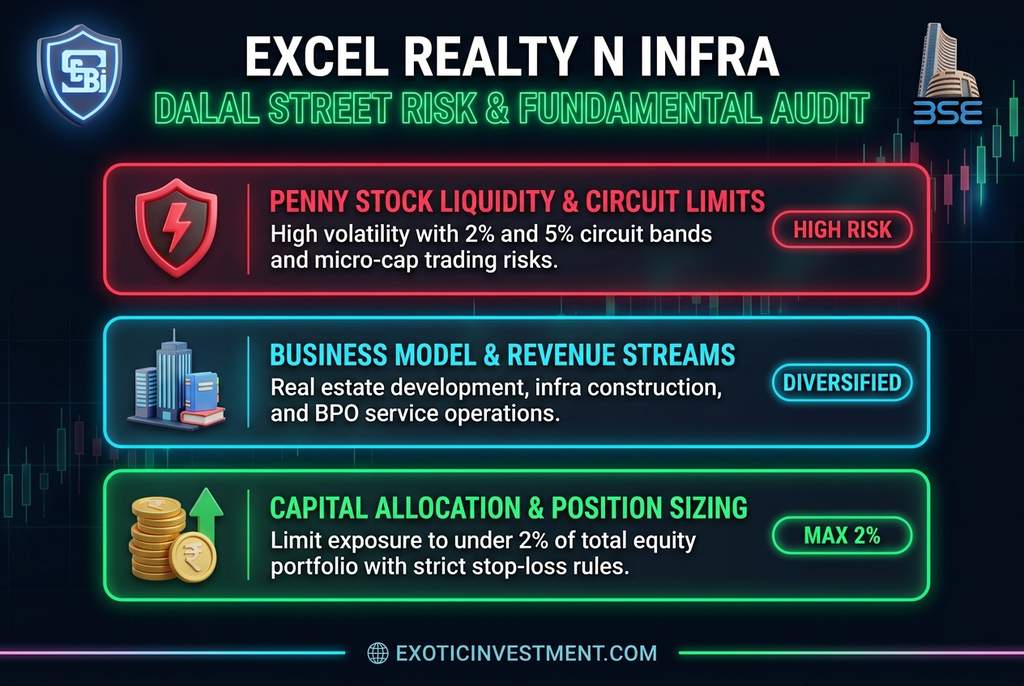
Illustration: Forensic Risk Audit for Excel Realty Share Price on NSE & BSE.
Second, check exchange surveillance tags immediately. When microcaps display sudden abnormal volume surges, SEBI and exchanges place them under the ASM and GSM surveillance framework, imposing 100% upfront cash margins and tight trade-to-trade settlement rules. Meanwhile, understanding upper circuit vs lower circuit limits explains why 2% or 5% daily price bands freeze exits completely during selloffs.
Excel Realty Share Price Risk Matrix: Speculation vs Institutional Quality
Auditing the excel realty share price side by side against disciplined institutional investment criteria keeps emotional FOMO completely out of your demat account. Specifically, compare microcap circuit dynamics against established Dalal Street standards below.
| Audit Parameter | Penny / Microcap Profile | Institutional Leader Profile | Risk Control Action |
|---|---|---|---|
| Circuit Liquidity Risk | Frequent 2%–5% circuit locks | Deep two-way institutional liquidity | Never risk core capital in circuit stocks |
| Institutional Ownership | Near 0% Mutual Fund / FII stake | Strong DII & FII research coverage | Verify quarterly shareholding patterns |
| Stop-Loss Execution | Stops fail during lower circuits | Clean market fills at trigger price | Cap total microcap bet under 2% |
| Earnings Visibility | Volatile, lumpy quarterly profits | Consistent 15%+ ROCE & cash flow | Audit 5-year operating cash flows |
| Portfolio Role | Pure high-risk speculation only | Core long-term wealth engine | Prioritize quality over ticket price |
Technical Circuit Strategy and Smart Portfolio Allocation
When trading microcap counters, traditional textbook indicators often fail because thin order books gap directly from upper circuit to lower circuit. Specifically, studying order-book mechanics in how share price is determined plus 50 DMA and 200 DMA trend filters helps you spot distribution tops before liquidity dries up.
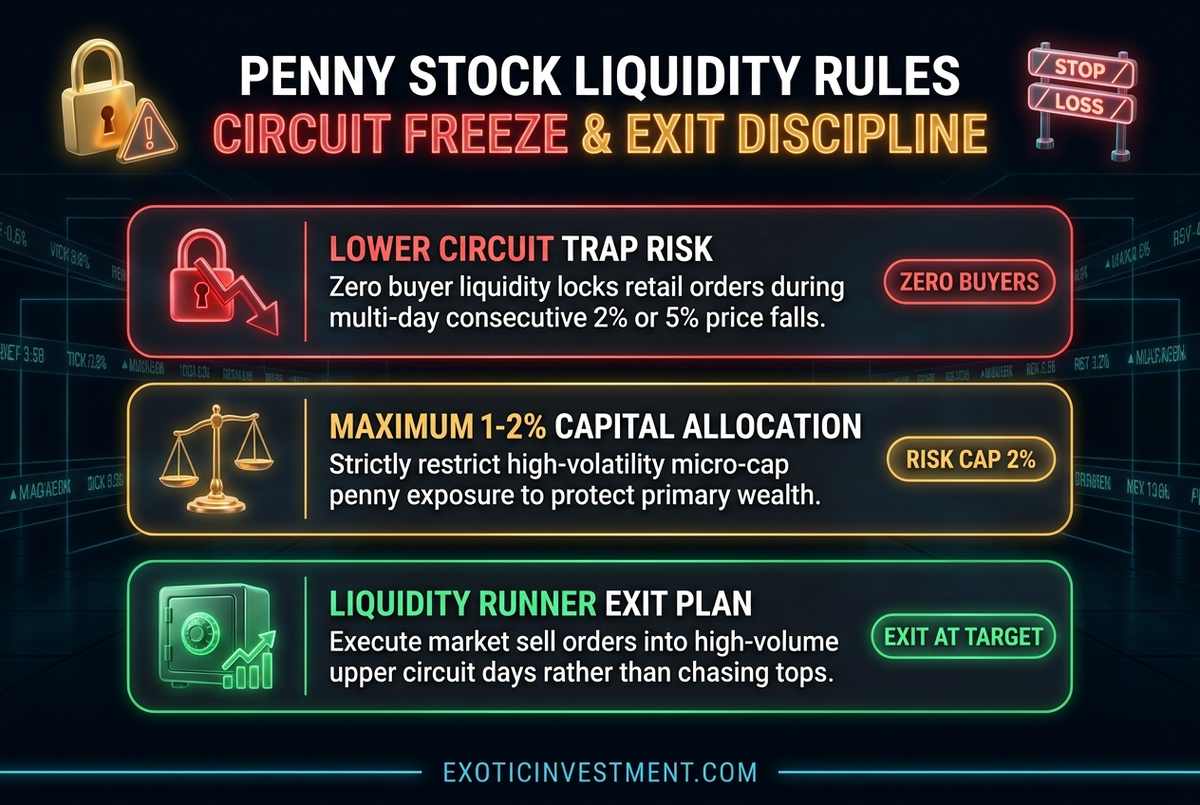
Illustration: Managing Circuit Risk & Exit Discipline on Penny Stocks.
In addition, always protect active swing entries using a disciplined stop loss vs trailing stop loss framework, verify your risk to reward ratio in trading, and apply pure price action trading strategies in India only on liquid stocks. Meanwhile, check net gains and brokerage fees via our stock profit calculator, Zerodha brokerage calculator, and stock market tax calculator.
🚀 Build Real MultiBagger Wealth—Skip Penny Stock Traps
Stop gambling on operator-driven circuit stocks. Learn how to screen debt-free, institutional-grade Indian growth leaders directly from Dr. Ashok Kumar N Rao.
- Master foundational equity screening with our Kannada bestseller Kaliyiri Share Market Book and our English handbook Basics of Indian Stock Market Book.
- Access institutional screeners and complete research modules via the MultiBagger Plus Courses & Pro Tools Annual Subscription.
- Master clean chart entries in our Technical Analysis Course in Kannada or options frameworks in our Options Buying Course in Kannada.
Building a Core Compounding Foundation First
Instead of risking serious family savings in sub-₹5 counters, anchor 85% to 90% of your capital in proven wealth builders. Specifically, tracking market leaders across Nifty vs Sensex benchmarks and low-cost ETFs in India delivers reliable compounding without circuit nightmares. Finally, plan long-term financial milestones via our SIP calculator, lumpsum calculator, reverse CAGR calculator, and global S&P 500 and Nasdaq 100 investing.
Five-Point Checklist Before Touching Any Sub-₹10 Indian Stock
Disciplined Dalal Street veterans never buy a microcap on social media tips or viral video rumors. Instead, they run a cold five-point forensic filter before risking a single rupee. First, inspect five years of audited operating cash flows, not just headline accounting profit. Specifically, healthy companies convert reported profits into real bank cash consistently. However, weak microcaps often show paper profits alongside rising unpaid receivables.
Second, check promoter holding trends across the last eight quarters. If promoters quietly reduce their stake during sudden retail price rallies, treat that as a flashing red warning. In contrast, rising promoter buying signals genuine insider conviction. Third, examine total equity dilution history over the past decade. For example, repeated preferential allotments or giant share issuances permanently depress per-share earnings power.
Fourth, study daily delivery volume ratios on the NSE and BSE portals. In fact, real institutional accumulation shows steady delivery percentages across several calm weeks. Conversely, operator-driven pumps feature sudden volume explosions followed immediately by upper-circuit locks and dry order books. As a result, late retail buyers get trapped holding illiquid shares for months.
Fifth, define your maximum rupee risk before clicking buy. Specifically, limit total penny exposure to spare learning capital you can hold without stress. Meanwhile, keep your core wealth growing in debt-free mid-cap and large-cap compounders. In addition, review your portfolio quarterly to cut laggards swiftly. Consequently, small speculative lessons never derail your primary financial goals. Ultimately, patience and strict capital protection always defeat get-rich-quick shortcuts on Dalal Street.
💡 Frequently Asked Questions About Excel Realty Share Price
Is Excel Realty N Infra listed on both NSE and BSE?
Yes, Excel Realty N Infra Ltd trades on both NSE (EXCEL) and BSE, though daily volumes can fluctuate sharply during circuit sessions. Always check trade-to-trade settlement rules under delivery and CNC trading rules before placing orders.
Why does Excel Realty share price hit frequent upper and lower circuits?
Microcap stocks under exchange surveillance often carry narrow 2% or 5% daily price bands, causing order books to lock quickly whenever sudden retail buying or selling waves arrive. Review exchange band rules in upper and lower circuits to understand exit delays.
Can beginners trade Excel Realty N Infra on intraday margin?
Most Indian brokers block intraday margin on penny stocks under surveillance and require 100% upfront CNC cash delivery. In fact, studying realistic day-trading odds in is intraday trading profitable in India explains why microcaps are unsuitable for intraday trading.
What is the safest way to size a speculative penny stock position?
Never allocate more than 1% to 2% of your total portfolio to any single speculative microcap, treating it strictly as money you can afford to hold through steep volatility. Verify exact rupee limits using our position size calculator.
How can I check if Excel Realty is under SEBI ASM or GSM restrictions?
Search the stock ticker on the official NSE or BSE website or check the warning banner inside Zerodha Kite or Groww before placing an order. Learn how every stage impacts your liquidity in our ASM and GSM surveillance guide.
How does margin borrowing affect penny stock holdings?
Penny stocks are non-marginable for pledge collateral, meaning they add zero trading margin to your account. Review broker collateral rules in used margin and available margin before planning portfolio liquidity.