FII DII Data Analysis: Daily Activity & Flow Tracker
Track daily Foreign Institutional Investor (FII) and Domestic Institutional Investor (DII) cash market buying, selling, and derivative index futures long/short positioning on NSE and BSE.
FII DII DAILY CASH & DERIVATIVES FLOW TRACKER
| Trading Date | FII Buy (₹ Cr) | FII Sell (₹ Cr) | FII Net (₹ Cr) | DII Buy (₹ Cr) | DII Sell (₹ Cr) | DII Net (₹ Cr) | Net Market Impact |
|---|
⚡ How to Read Institutional Smart Money Flows
Track Cash Market Net Flow
Observe whether foreign funds are aggressive buyers or sellers in the Indian equity cash segment.
Compare Domestic Support
Verify whether DII mutual funds and insurers absorb foreign supply through systematic SIP inflows.
Audit Index Long/Short Ratio
Look at FII index futures open interest. A ratio below 25% signals extreme oversold institutional posture.
Identify Crowd Divergence
Trade with institutional smart money when retail traders are trapped on the wrong side of the market trend.
Following the Elephants: Why FII DII Data Analysis Decides Nifty Trends
In the Indian stock market, retail traders are like fish swimming in the ocean, while Foreign Institutional Investors (FIIs) and Domestic Institutional Investors (DIIs) are the whales. If the whales decide to swim south, fighting them with single-lot call options is financial suicide.
Daily fii dii data analysis strips away the noisy headlines on television and reveals where real money is actually moving. FIIs move global liquidity into Dalal Street based on currency rates, US bond yields, and valuation premiums. Meanwhile, domestic institutions provide rock-solid support through ₹20,000+ Crore in monthly domestic SIP inflows.
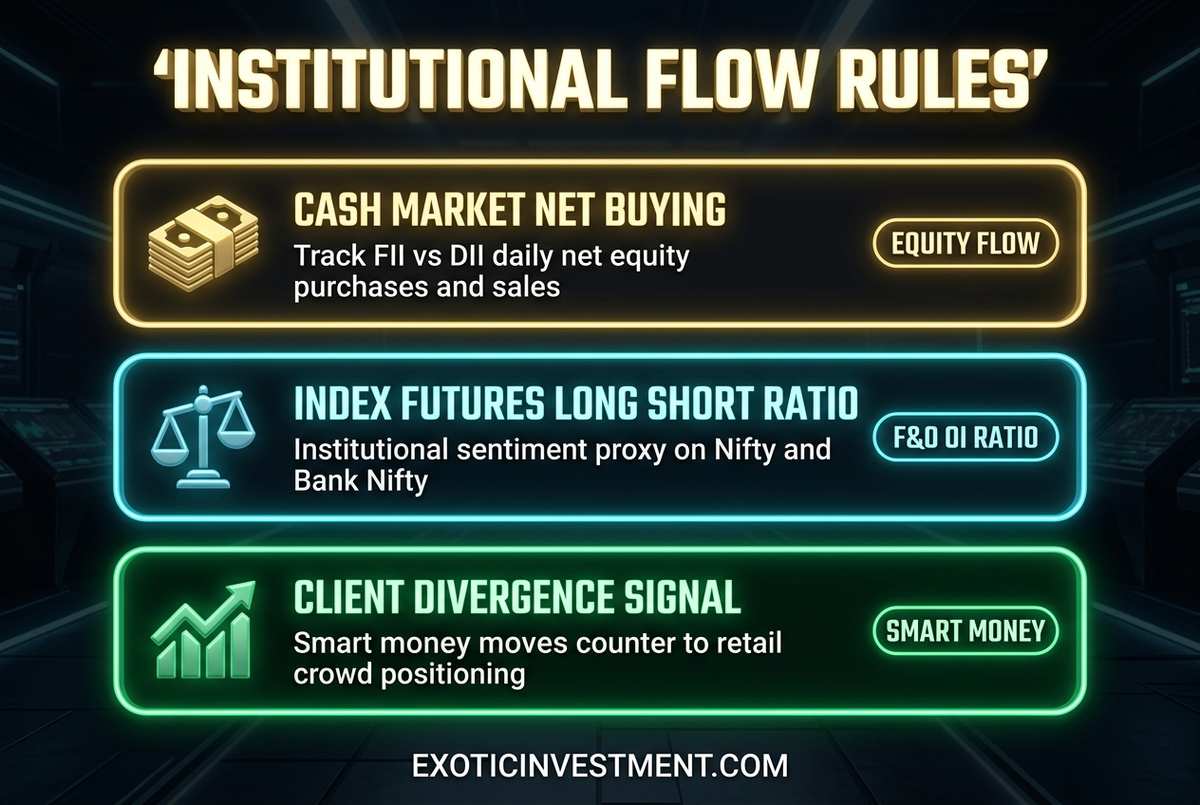
Figure 1: Institutional framework for interpreting cash equity and derivatives participant positioning.
Cash Market Flow vs Derivatives Open Interest
Beginner traders only check headline cash numbers. Professional trading desks analyze the dual-layer relationship between cash equity and derivatives:
- Cash Buying + Futures Long Build-up: The strongest institutional bullish regime. High conviction accumulation across large-cap heavyweights.
- Cash Selling + Futures Short Build-up: Aggressive institutional distribution. Nifty and Bank Nifty face intense overhead resistance.
- Cash Selling + Futures Short Covering: Short-term relief bounces and market consolidation. FIIs square off shorts while reducing cash beta.
The FII Index Futures Long/Short Sentiment Ratio
The FII Long/Short ratio measures the proportion of bullish vs bearish contracts held by foreign funds in index futures. When this ratio plunges below 20%, it signals historic pessimism — often marking major market swing bottoms where sudden short squeezes explode upward. Conversely, ratios above 80% indicate overheated sentiment ripe for profit booking.
📋 Regulatory References & Data Sources
- NSE Master Circular on Trading Operations & Derivative Contracts
- SEBI Master Circular for Mutual Funds & Derivative Exposure limits
- Securities Contracts (Regulation) Rules 1957 — Contract settlement guidelines
Disclaimer: This calculator is for educational and planning purposes only. It does not constitute financial advice. Consult a SEBI-registered investment advisor for personalised guidance. Tax rules are updated as per the latest Finance Act — verify with a qualified CA before filing.
🛠️ More Helpful Tools & Calculators
💡 Frequently Asked Questions — FII & DII Data Analysis
What is FII and DII in the Indian stock market?
Foreign Institutional Investors (FIIs) are international asset management firms, hedge funds, and sovereign wealth funds investing in India. Domestic Institutional Investors (DIIs) represent Indian mutual funds, insurance companies (like LIC), and pension trusts. Compare their influence against our Relative Strength RS Scanner.
What time is daily FII DII activity released by NSE and BSE?
Provisional cash market flow numbers are released every trading evening around 5:30 PM to 6:00 PM IST by NSE and BSE. Detailed derivatives participant open interest data follows shortly after 7:00 PM IST.
How does FII selling impact Nifty 50 and Bank Nifty?
Because FIIs hold significant stakes in index heavyweights (such as HDFC Bank, Reliance, and ICICI Bank), concentrated foreign selling puts immediate downward pressure on benchmark indices. Verify underlying contract lot sizing on our NSE F&O Lot Size List.
Can DII buying counteract heavy FII selling?
Yes. India’s domestic retail mutual fund SIP inflow (crossing ₹20,000+ Crore monthly) provides massive capital that enables DIIs to absorb institutional foreign selling, stabilizing market drawdowns during global corrections.
How do FIIs hedge their cash equity holdings using derivatives?
FIIs often sell index futures or buy index put options as a portfolio hedge when expecting short-term volatility. You can evaluate portfolio risk using our Value at Risk (VaR) Calculator and simulate hedges on our Monte Carlo Portfolio Simulator.
What does a high or low FII Long/Short ratio mean?
A ratio below 25% indicates that FIIs are overwhelmingly short on index futures, which often precedes aggressive short-covering rallies. A ratio above 75% indicates extreme bullishness, warning of impending consolidation. Lock in disciplined risk control with our Trading Risk Management Calculator.
Where can I check if stocks with heavy FII open interest enter F&O ban?
Check our real-time NSE F&O Ban List Today page to identify stocks exceeding 95% of their Market-Wide Position Limit (MWPL).
How do retail clients trade compared to smart money institutions?
NSE participant open interest data regularly reveals that retail client positioning is opposite to FII flow. Retail traders tend to aggressively buy calls during market dips, while institutions write calls and build short futures hedges.
Where can traders learn institutional price action setups?
Access structured video training on Stock Market Basics & Price Action by Dr. Ashok Kumar N Rao, and test multi-asset market analytics on eMintage.
What exclusive flow analytics are included with Exotic Investment Pro?
Exotic Investment Pro members receive our 4-Way Participant Breakdown (FII vs DII vs Pro vs Retail Clients), 30-day cumulative net flow curves overlaid on Nifty charts, and full downloadable historical institutional flow archives.
