[CALC] VaR Calculator — Parametric, Historical & CVaR

Value at Risk (VaR) & CVaR Calculator

Quantify maximum potential portfolio downside across Parametric (Variance-Covariance), Historical Simulation, and Monte Carlo frameworks with Conditional Value at Risk (Expected Shortfall).

🛡️ Portfolio Risk Management Engine 🔒 PRO LOCKED
🔹 Simultaneous: Parametric, Historical & Monte Carlo 🔹 Metric: VaR & CVaR (Expected Shortfall) 🔹 Standard: Basel Committee Market Risk Model

Value at Risk (VaR) & CVaR Engine

Select Confidence Level
Time Horizon & Portfolio Size
Asset Allocation & Diversification Benefit
Max Expected Loss (Parametric)
₹19,250
At 95% confidence over 1 day (1.93% of capital)
Parametric VaR (Variance-Covariance) ₹19,250 (1.93%)
Historical Simulation VaR ₹21,100 (2.11%)
Monte Carlo VaR (10k Paths) ₹19,800 (1.98%)
CVaR / Expected Shortfall ₹24,800 (2.48%)
Diversification Risk Reduction -₹4,250 saved
Scaled 1-Year (252D) Max VaR ₹3,05,500
💎 Multibagger Pro Suite
Stressed VaR (2008 & 2020 Shock) PRO 🔒 Unlock
Component & Marginal VaR Breakdown PRO 🔒 Unlock
Backtesting Exceptions Report PRO 🔒 Unlock
🛡️

Unlock Institutional Risk Management

Access Stressed VaR historical overlays, Component & Marginal risk contributions, and downloadable institutional PDF audit reports.

₹4,999/yr ₹2,739 / year
🚀 Activate Multibagger Pro Now

How It Works in 4 Steps

1

Set Portfolio Capital

Enter total portfolio market value and annual realized or implied asset volatility.

2

Choose Confidence Level

Select risk thresholds: 95% standard regulatory, 99% Basel institutional, or 99.5% tail risk.

3

Define Time Horizon

Scale potential drawdown over 1 day, 1 trading week (5D), 1 month (21D), or 1 financial year.

4

Review CVaR Shortfall

Examine Expected Shortfall tail risk if catastrophic downside breaches standard VaR limits.

Understanding Value at Risk: The Three Institutional Methodologies

Value at Risk (VaR) is the standard statistical framework adopted by institutional trading desks, mutual funds, and SEBI-regulated Portfolio Management Services to quantify potential portfolio loss over a defined timeframe at a specified confidence level.
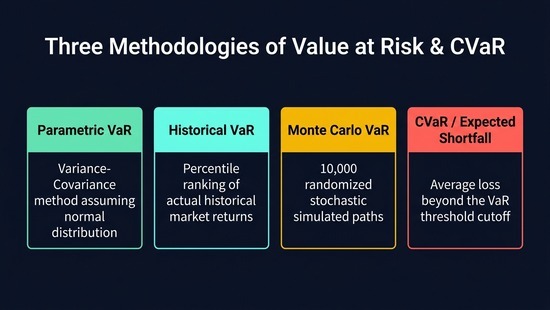
Three Methodologies of Value at Risk and CVaR Comparison

1. Parametric (Variance-Covariance) VaR

Parametric VaR assumes asset returns follow a normal bell-curve distribution. By multiplying portfolio volatility by the statistical standard score (Z = 1.645 for 95%, Z = 2.326 for 99%), it produces instant analytical risk figures. While computationally efficient, it can understate extreme tail risks in volatile Indian equity markets.

2. Historical Simulation VaR

Rather than assuming theoretical normal distributions, Historical Simulation evaluates your current portfolio against actual historical daily returns of the Nifty 50 or underlying stocks over past market cycles (such as the 2008 Lehman collapse or March 2020 crash), capturing authentic market skewness and kurtosis.

3. Monte Carlo Simulation & CVaR (Expected Shortfall)

Monte Carlo modeling simulates 10,000 randomized stochastic price paths using Brownian motion. Conditional VaR (CVaR), or Expected Shortfall, answers the critical question: “When an extreme market crash breaches the 95% VaR barrier, what is the average catastrophic loss?”

📋 Regulatory References & Data Sources
  • SEBI risk management framework guidelines
  • Reserve Bank of India (RBI) financial market benchmark data
  • Income Tax Department of India rules & circulars

Disclaimer: This calculator is for educational and planning purposes only. It does not constitute financial advice. Consult a SEBI-registered investment advisor for personalised guidance. Tax rules are updated as per the latest Finance Act — verify with a qualified CA before filing.

Frequently Asked Questions — Value at Risk (VaR) & CVaR

What does a 95% 1-day Value at Risk (VaR) of ₹20,000 mean?
A 95% 1-day VaR of ₹20,000 indicates that on 95 out of 100 trading sessions, your daily portfolio drawdown is statistically projected not to exceed ₹20,000 under normal market conditions. Conversely, on 5% of trading days (approximately 1 session every month), market losses can exceed this threshold. To model how these periodic drawdowns compound across long-term wealth trajectories, investors simulate stochastic outcomes using the Monte Carlo Portfolio Simulator, while cross-asset crypto investors monitor multi-token portfolio drawdowns in real time with the Crypto Portfolio Tracker on eMintage.

What is the difference between VaR and Conditional VaR (CVaR / Expected Shortfall)?
Value at Risk (VaR) only identifies the minimum loss threshold at a specified confidence level (e.g., the 95th percentile cutoff), remaining blind to the magnitude of losses beyond that boundary. In contrast, Conditional VaR (CVaR), also known as Expected Shortfall (ES), computes the expected average loss of all tail scenarios that breach the VaR threshold. Quantitative asset allocators combine CVaR metrics with the Markowitz Efficient Frontier to construct crash-resilient asset weights, whereas decentralized liquidity providers measure severe asymmetric tail divergence using the Crypto Impermanent Loss Calculator on eMintage.

How does the square root of time rule scale intraday VaR to multi-day horizons?
Under classical finance theory (assuming independent and identically distributed returns), a 1-day VaR is scaled across a multi-day horizon (T) using the square root of time formula: VaR(T) = VaR(1-Day) × √T. For instance, a 5-day weekly VaR scales by √5 (~2.236), while a 21-day monthly VaR scales by √21 (~4.583). Professional equity traders map this scaled volatility directly into their order execution brackets via the Position Size Calculator to prevent account overleveraging, while systematic investors counter time-horizon volatility spikes through disciplined recurring allocations via the Crypto DCA Calculator on eMintage.

Why is multi-asset covariance and correlation vital when calculating portfolio VaR?
Portfolio risk is rarely the simple arithmetic sum of individual asset risks. When assets exhibit low or negative correlation (such as Indian equities paired with Sovereign Gold Bonds or defensive debt instruments), the portfolio variance decreases through diversification benefits. Portfolio managers evaluate this systematic sensitivity against benchmark indices with the Beta Calculation for Indian Stocks. Similarly, decentralized market participants screen out illiquid fraudulent tokens that distort correlation matrices using the Rug Pull Detector on eMintage.

Why does the Basel Committee require a 99% confidence level instead of 95%?
The Basel Committee for Banking Supervision (BCBS) mandates a 99% confidence interval over a 10-day liquidity horizon for regulatory capital adequacy to ensure commercial banks and institutions survive rare systemic credit and liquidity shocks. While retail swing traders frequently utilize a 95% confidence standard, institutional derivative clearinghouses adjust portfolio maintenance margin requirements using the SPAN Margin Calculator F&O, whereas high-leverage crypto traders stress test borrowing safety cushions and liquidation triggers using the Crypto Margin Trading Calculator on eMintage.

Why does Historical Simulation VaR outperform Parametric VaR during market crashes?
Parametric (Variance-Covariance) VaR assumes that financial returns follow a standard Gaussian bell-curve distribution, which severely underestimates the fat-tail risk (excess kurtosis) and negative skewness observed during historical crashes such as March 2020 or October 2008. Historical simulation bypasses theoretical curve assumptions by repricing the portfolio against authentic daily price series. To protect capital against ruinous black swan distributions, traders calculate mathematically sound allocation fractions using the Kelly Criterion Sizing Calculator and adjust digital asset exposure limits with the Crypto Position Calculator on eMintage.

How do derivative traders incorporate non-linear Option Greeks into Value at Risk?
Vanilla equity portfolios feature linear payoffs, but option contracts exhibit non-linear delta, gamma, and vega sensitivities that alter portfolio risk dynamically as the underlying asset fluctuates. Derivatives desks compute delta-gamma VaR approximations and stress test implied volatility changes using the Black-Scholes Greeks Calculator, while active crypto options and perpetual traders automate bracket limits with the Crypto Stop Loss Take Profit Calculator on eMintage.

What impact do execution fees, statutory STT, and slippage have on real-world VaR liquidation?
In actual market sell-offs, bid-ask spreads widen dramatically, producing significant negative slippage that compounds standard statistical VaR projections. In addition, statutory levies including Securities Transaction Tax (STT), exchange turnover charges, SEBI turnover fees, and stamp duty reduce recoverable capital. Active market participants calculate these total friction costs via the Indian Stock Brokerage Calculator, while on-chain traders quantify Ethereum and Layer-2 blockchain transaction overhead before executing emergency stop orders using the Crypto Gas Fee Calculator on eMintage.

How does capital gains taxation affect net portfolio risk and post-tax equity?
When an investor liquidates equity holdings or defensive hedges to protect against a catastrophic VaR breach, the liquidation crystallizes short-term or long-term capital gains tax liabilities that directly diminish net post-tax portfolio value. Indian investors quantify their updated tax liabilities under Finance Act amendments using the STCG vs LTCG Capital Gains Tax Calculator, while virtual digital asset traders calculate their flat 30% tax liability and 1% Section 194S TDS deductions using the Crypto Tax Calculator on eMintage.

How should high-turnover traders balance risk management with portfolio rebalancing?
Frequent defensive hedging and tactical asset shifts increase overall portfolio turnover and can trigger Section 44AB tax audit thresholds under SEBI guidelines. To maintain optimal target asset allocations without incurring excessive friction or tax drag, investors deploy the Portfolio Rebalancing Calculator, while crypto market analysts track large-scale institutional smart money flows to anticipate volatility shocks with the Whale Wallet Tracker Crypto on eMintage.

AR
Written & Verified By

Dr.Ashok Kumar N Rao

Stock Market Educator & Author | 3,500+ Students Trained

Alternative Investments advisor and author of 'Basics of Stock Market for Beginners' and 'ಕಲಿಯಿರಿ ಶೇರ್ ಮಾರ್ಕೆಟ್'. All financial tools and content on this site are reviewed personally before publication.