Tracking indian adr live price quotes on Wall Street gives Indian traders a powerful window into global institutional sentiment. Because American Depository Receipts trade on the New York Stock Exchange and NASDAQ while Dalal Street sleeps, overnight US price action frequently dictates the opening gap on the National Stock Exchange. In real trading desks, disciplined market participants never place 9:15 AM opening orders without analyzing overnight ADR closing prints.
Specifically, blue-chip Indian giants like Infosys, HDFC Bank, and ICICI Bank command high daily trading liquidity across US bourses. When foreign portfolio investors adjust their emerging market allocations, ADR prices react immediately to macroeconomic developments. Therefore, understanding currency dynamics and ADR share ratios protects your capital from unexpected market opening whipsaws.
Decoding American Depository Receipts and Share Ratios
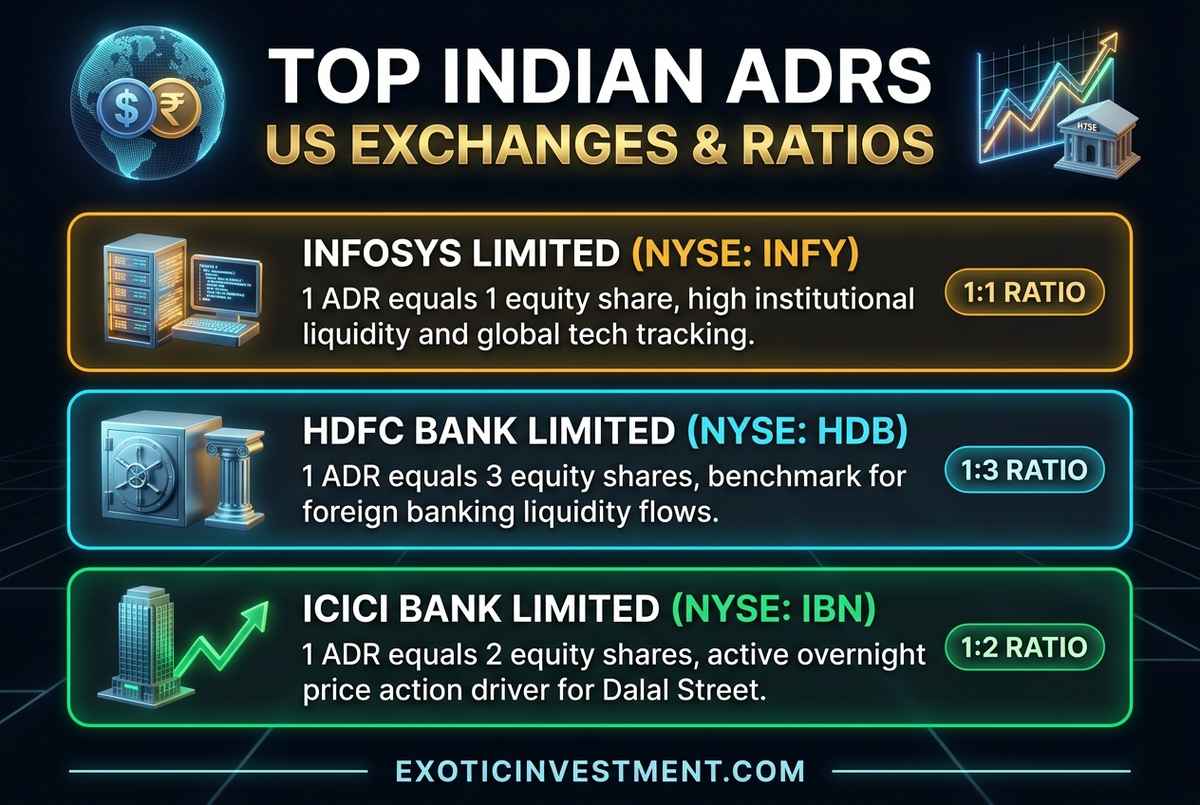
Listen closely, because retail investors frequently commit expensive mistakes by comparing US dollar ADR quotes directly to domestic rupee prices. In reality, each American Depository Receipt represents a specific, predefined quantity of underlying domestic shares held by a US depository custodian bank. For example, while Infosys trades at a clean 1:1 ratio, other banking leaders maintain multi-share conversion structures.
Because of these varying conversion ratios, calculating the exact rupee-implied share price requires multiplying the dollar price by the prevailing USD-INR exchange rate and dividing by the ADR ratio factor. Astute traders monitor these conversion mechanics using essential stock price terms to avoid distorted valuation assumptions. In addition, studying historical price parity helps you spot genuine institutional accumulation.
Currency Swings and ADR Arbitrage Mechanics
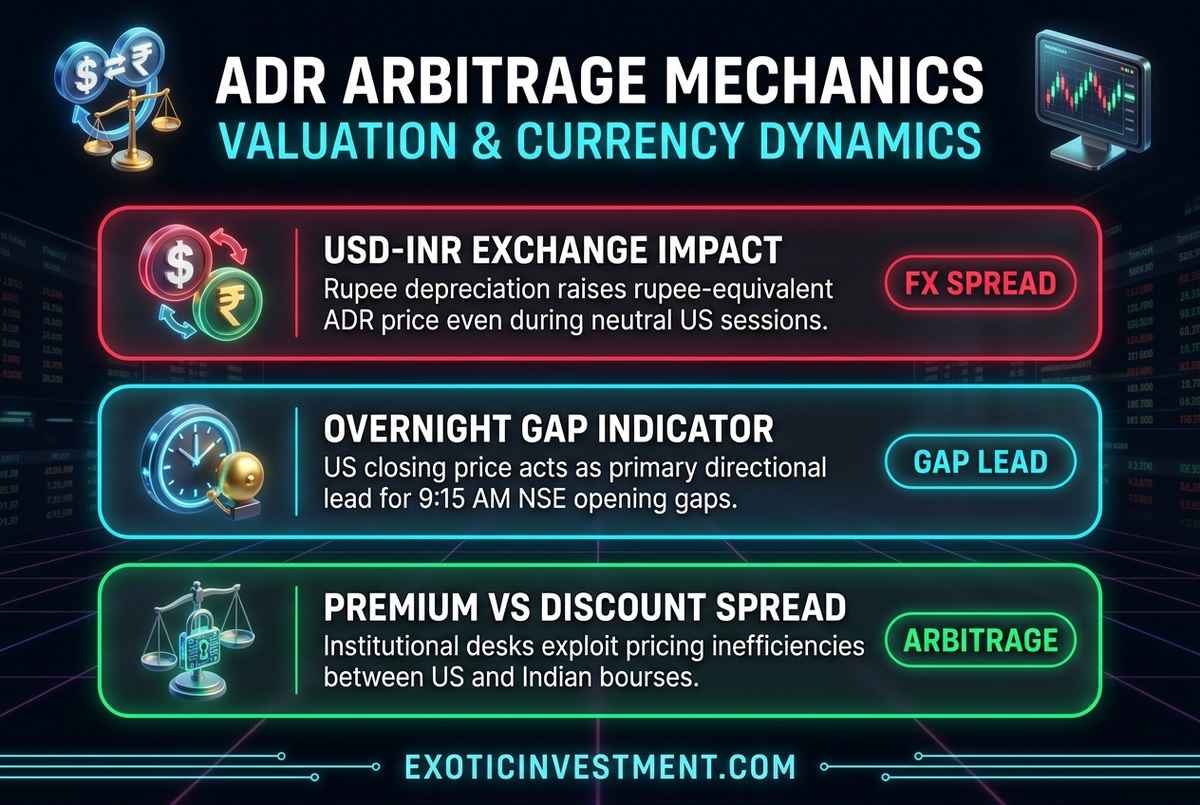
Foreign exchange fluctuations exert an enormous mathematical impact on cross-border equity valuations. When the Indian Rupee depreciates against the US Dollar, domestic equities become cheaper for dollar-denominated foreign institutions. Consequently, an Indian ADR can rally in US trading sessions simply because of currency adjustments, even if the underlying company fundamentals remain unchanged.
Conversely, rapid rupee appreciation increases the dollar value of domestic assets, prompting foreign funds to recalibrate their position sizes. Professional proprietary trading desks constantly calculate arbitrage spreads between New York and Mumbai bourses. You can project your potential net gains and transaction margins with our stock profit calculator before executing multi-market setups.
Similarly, analyzing long-term compounding across global technology leaders requires studying historical returns. Smart market participants evaluate growth trajectories using our free reverse CAGR calculator to verify whether earnings justify current market multiples. In fact, sustainable wealth building requires separating currency fluctuations from genuine earnings expansion.
| Indian Company / Ticker | US Exchange Ticker | ADR to Share Ratio | Dalal Street Impact |
|---|---|---|---|
| Infosys Limited | NYSE: INFY | 1 ADR = 1 Equity Share | Direct Gap Indicator |
| HDFC Bank Limited | NYSE: HDB | 1 ADR = 3 Equity Shares | Banking Liquidity Driver |
| ICICI Bank Limited | NYSE: IBN | 1 ADR = 2 Equity Shares | High Overnight Beta |
| Dr. Ashok Desk Rule | Overnight FX Normalization | Strict Ratio Scaling | Wait 15-Mins After Open |
Trading Desk Risk Rules and Pre-Market Execution
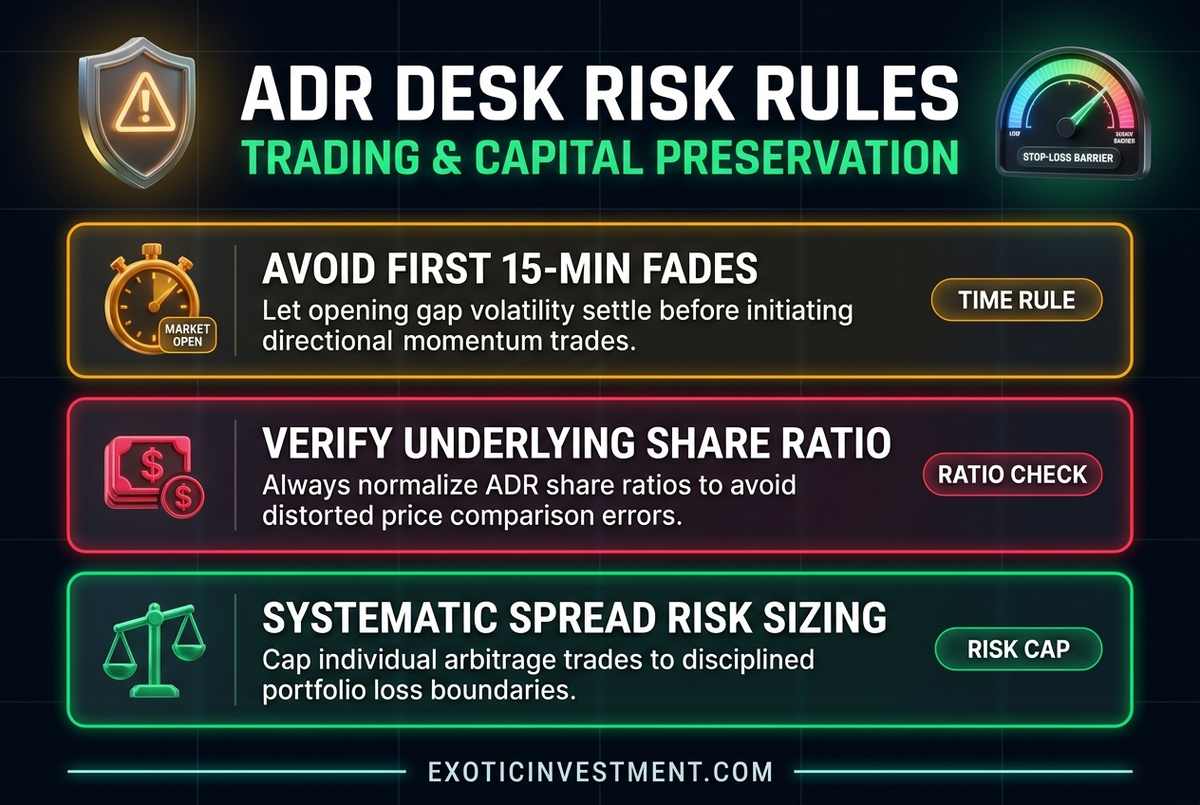
Here is the real deal about trading morning opening gaps triggered by overnight ADR moves. Novice traders often rush to buy stocks at 9:15 AM when an ADR closes significantly higher in the US session. However, institutional market makers routinely dump opening inventory onto retail buyers, resulting in sharp opening fades.
Therefore, our desk enforces a strict rule: wait at least 15 minutes for the opening range to settle before initiating fresh directional trades. If the opening price sustains above the initial 15-minute high with heavy delivery volume, the bullish continuation possesses high statistical probability. You can study these settlement mechanics in our detailed guide on delivery and CNC trading rules.
In addition, never commit more capital than your predefined risk tolerance permits. You should systematically calibrate your trade quantities using our free position size calculator to eliminate emotional guesswork. Disciplined position sizing ensures that a single gap-down never threatens your long-term portfolio survivability.
🚀 Master Global Portfolio Allocation & Compound Wealth
Build an all-weather investment portfolio combining Indian market leaders with global tech compounders. Learn directly from Dr. Ashok Kumar N Rao.
- Master foundational stock market principles with our book Kaliyiri Share Market Book and our English handbook Basics of Indian Stock Market Book.
- Accelerate your research with institutional screeners through the MultiBagger Plus Courses & Pro Tools Annual Subscription.
- Master chart setups by enrolling in our structured Technical Analysis Course in Kannada or options mechanics in our Options Buying Course in Kannada.
Strategic Long-Term Portfolio Allocation
Ultimately, monitoring Indian ADR live prices helps you understand where global capital is flowing before the local market rings its opening bell. Instead of treating ADRs as speculative intraday gambles, view them as institutional sentiment barometers. For instance, long-term investors can structure disciplined systematic investments using our SIP calculator online to compound wealth steadily.
In addition, managing high-net-worth portfolios requires keeping tabs on trading overheads, currency conversion fees, and exchange turnover taxes. Many active participants underestimate how transaction friction erodes compounded returns. You can review exact charges across Indian brokers with our Zerodha brokerage calculator.
💡 Frequently Asked Questions (FAQ)
What is an Indian ADR and how does live US trading impact NSE opening prices?
An Indian ADR is a US dollar-denominated negotiable certificate representing shares of an Indian corporation traded on American exchanges. Because US bourses trade overnight, ADR closing movements offer direct directional cues for 9:15 AM opening gaps. Understand key quoting terminology by reviewing our guide on stock price terms.
How do currency exchange fluctuations affect Indian ADR prices?
When the Indian Rupee depreciates against the US Dollar, the rupee-equivalent value of an ADR rises automatically even during flat market sessions. You can model expected currency adjusted returns using our free reverse CAGR calculator to evaluate real earnings expansion.
Do Indian ADRs have price circuit limit filters like domestic stocks?
US exchanges do not follow strict Indian circuit limit bands (2%, 5%, or 20%), operating instead with volatility pauses known as Limit Up-Limit Down (LULD) bands. Learn how exchange surveillance mechanisms operate by reading our guide on upper circuit vs lower circuit rules.
How should retail traders manage risk when trading opening ADR gaps?
Traders should avoid chasing the immediate 9:15 AM opening price and wait 15 minutes for initial institutional inventory to clear. Always calculate strict trade quantities with our free position size calculator to safeguard your primary wealth.