
Today we’ll dive in-depth into nifty charts technical analysis.
Its imperative to mention that the Nifty is the gauge of the Indian Markets.
As a result of this, there is a huge huge following for the Nifty Charts.
Because of the displeasure to avoid analysis, many fail to read nifty charts technical analysis the right way.
Today, let’s look at the right way to analyze, the Nifty Trend for Today.
1) Nifty Charts Technical Analysis for 14th July 2022:
Free Nifty Technical Analysis Chart trading view reveals a great depth of indicators for technical analysis.
Let’s see what the Nifty trend speaks of today’s chart with an analysis of yesterday’s chart.
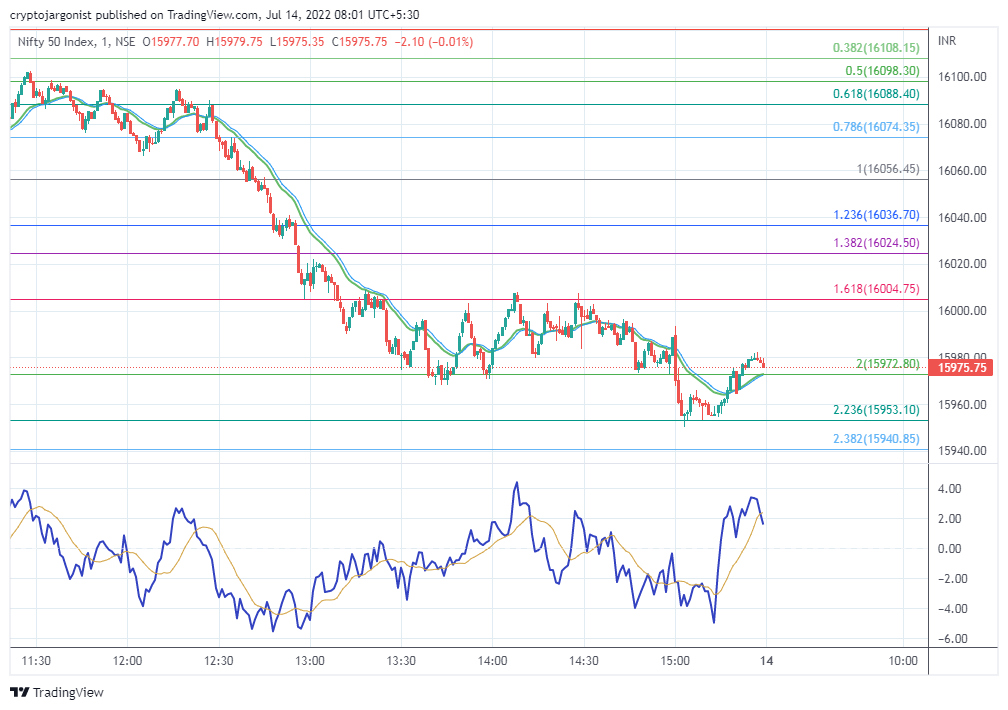
- In yesterday’s Nifty Trading View Analysis support and resistance analysis, I mentioned that 16000 and 15970 levels will be good supports.
- When support doesn’t hold, it becomes resistance. Hence 16000 levels became resistance and 15970 levels became support.
- When the Nifty starts a free fall, don’t start buying looking for a bottom. Though a ship is worth billions of dollars, you won’t buy it when it’s sinking. RIGHT?
- Find a simple Nifty Futures trading formula and stick to it, which my previous post can help.
- Just support and resistance mentioned yesterday could have gained you 70 points in Nifty Futures!
- Find the right levels to draw Fibonacci retracements suitable for your trading style.
- Since the support has been tampered with, the level of 15823 may be tested today, since there is no good news for the markets to rejoice.
2) SGX Nifty Trend for Today on July 14, 2022:
Today on 14th July 2022 SGX Nifty is showing 30 Points LOWER move at around 8:14 AM when I am writing this article.
SGX Nifty Trend on Live Chart denotes that the Indian Markets will react NEGATIVE TO NEUTRAL.
So Indian markets especially Nifty Trend Today would have a probably NEGATIVE start.
3) World Market Analysis for 14 JULY 2022:
S&P 500: -17.02 (-0.45%)
NASDAQ: -16.46 (-0.14%)
Dow Jones: -208.54 (-0.67%)
Nikkei: +185.6 (+0.7%)
World markets are not supportive, but the Japanese index denotes slight positivity denoting a positive move after the opening of the markets.
4) Nifty Supports and Resistances:
Nifty Supports: 15953, 15900, 15823
Nifty Resistances: 15978, 16000, 16025, 16170
GOOD READ: How To Choose The Best Option Strike Price For Landmark Success?
5) Nifty Charts Technical Analysis for 14th July 2022:
- SGX Nifty trend seems to find a negative to neutral stance at just 30 points down, which may change before 9:15 AM.
- Nifty 50 stocks chart technical analysis reveals that the support tampers and lower levels are possibly tested.
- Since many asked I request to deeply get nifty chart for technical analysis in place before moving further.
- Nifty Charts Technical Analysis Candlestick pattern reveals that we have deep support at 15953 – 950 levels which may push Nifty upwards.
- You can analyze nse nifty technical analysis charts using tradingview. Because of this Nifty Futures move also can be predicted.
- Having said that, the technical chart of nifty futures analysis yesterday was seen as bears having control.
- Including world technical analysis chart SGX nifty, we see a slightly negative start for Nifty today as a Gap Down.
MUST-READ: Can Day Trading Make You Rich For an Exhilarated Excuse Free Life?
Considering the trends globally and Technical Analysis Nifty Trend Today is SLIGHTLY NEGATIVE.
Follow me on Facebook and Youtube.
Happy Trading and Happy Money Making!