Order Cost Slippage Calculator — Market vs Limit Orders

Order Cost Slippage Calculator — Market vs Limit Orders

Calculate the hidden wealth lost to market order execution slippage, bid-ask spread friction, and institutional impact cost on NSE stocks and F&O.


ORDER EXECUTION FRICTION & SLIPPAGE AUDITOR
🔒 PRO LOCKED
₹10,00,000
1 bps = 0.01% of trade value.
Market depth exhaustion.
20 Trades / Month
ANNUAL WEALTH LOST TO SLIPPAGE
₹4,80,000 / Year
₹2,000 lost on every single market order
Bid-Ask Spread Loss (per trade) ₹800
Market Impact Cost (per trade) ₹1,200
Total Execution Friction % 0.20% (20 bps)
MONTHLY EXECUTION DRAG ₹40,000 / mo
⚠️ The Invisible Trading Tax:
Traders focus intensely on broker commissions, but execution slippage typically bleeds 4x to 8x more capital than brokerage over an active trading year.
⚡ Algorithmic Iceberg Slicing & TWAP Simulator: Eliminate 65% of market order slippage using volume-weighted order routing.

How It Works in 4 Steps

1

Enter Order Turnover

Input total value of your buy or sell transaction in Indian Rupees.

2

Set Bid-Ask Spread

Define the spread width in basis points (e.g. 5 to 25 bps based on stock liquidity).

3

Define Market Impact Cost

Estimate liquidity depth consumption for your order size.

4

Evaluate Annual Leakage

Instantly compute total rupee capital lost each month and year to slippage.

The Invisible Trading Tax: Slippage and Execution Friction

Most active retail traders obsess over broker commissions (₹20 per order) while remaining completely oblivious to execution slippage—the invisible cost that typically bleeds 4x to 8x more capital over an active trading career.

When you execute a market order, you pay the immediate market ask or sell at the immediate market bid, instantly forfeiting half the spread width. For larger trade sizes, your order sweeps through multiple order book tiers, causing substantial impact cost.
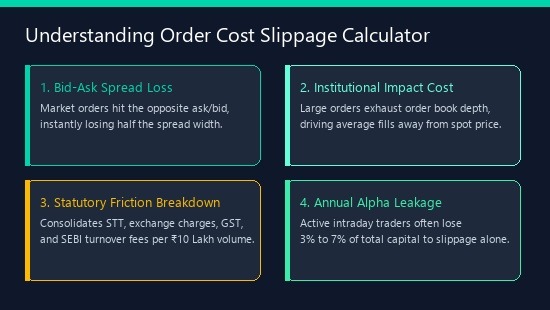
Order Cost Slippage Calculator — Market vs Limit Orders Explainer Diagram


📋 Regulatory References & Data Sources
  • STT rates: Finance Act 2024 — equity delivery 0.1%, intraday 0.025%
  • SEBI circular — transaction charges applicable on NSE/BSE
  • Stamp Duty: Indian Stamp Act 1899, as amended by Finance Act 2019 — 0.015% on equity delivery buy side
  • GST at 18% on brokerage as per CGST Act 2017

Disclaimer: This calculator is for educational and planning purposes only. It does not constitute financial advice. Consult a SEBI-registered investment advisor for personalised guidance. Tax rules are updated as per the latest Finance Act — verify with a qualified CA before filing.

Frequently Asked Questions — Order Cost Slippage Calculator — Market vs Limit Orders

What is slippage in stock and F&O trading?
Slippage is the difference between the expected price of a trade and the actual execution price filled by the exchange matching engine.

What is the difference between bid-ask spread and impact cost?
The bid-ask spread is the price difference between the best buyer and best seller. Impact cost occurs when an order is too large for the top level of the book, forcing fills at worse prices.

How much money do active traders lose to slippage annually?
An active intraday trader executing 30 trades a month with ₹10 Lakh turnover can easily lose ₹4 Lakh to ₹7 Lakh annually to execution slippage alone.

How do limit orders eliminate slippage?
Limit orders specify the exact maximum price you are willing to pay (or minimum to sell), guaranteeing price certainty at the cost of potential non-execution.

What are basis points (bps) in trading friction?
One basis point equals 0.01% (or 1/100th of 1%). A 15 bps slippage on a ₹10,000,000 order represents a ₹15,000 execution loss.

Which NSE stocks have the lowest bid-ask spreads?
High-liquidity Nifty 50 constituents like Reliance, HDFC Bank, and TCS maintain tight spreads of 1 to 3 bps. Illiquid small-caps often suffer 30 to 80+ bps spreads.

How does volatility impact options slippage?
During high-volatility events like RBI policy or budget announcements, option bid-ask spreads widen dramatically, creating severe execution friction.

What is an iceberg order?
An iceberg order is an algorithmic execution order that slices a large institutional order into smaller visible child orders to avoid alerting the market and triggering impact cost.

Does stop-loss market (SL-M) order cause high slippage?
Yes. When an SL-M order is triggered, it turns into an immediate market order, often filling at terrible prices during fast market crashes.

How can crypto traders track decentralized exchange slippage?
Decentralized crypto swaps suffer automated market maker (AMM) slippage. Traders can monitor gas friction using the Crypto Margin Trading Calculator on Emintage and track whale orders with the Whale Wallet Tracker on Emintage.


AR
Written & Verified By

Dr.Ashok Kumar N Rao

Stock Market Educator & Author | 3,500+ Students Trained

Alternative Investments advisor and author of 'Basics of Stock Market for Beginners' and 'ಕಲಿಯಿರಿ ಶೇರ್ ಮಾರ್ಕೆಟ್'. All financial tools and content on this site are reviewed personally before publication.