Benchmark trailing P/E, forward P/E, and PEG ratios against 5-year historical sector medians across Indian equities to detect undervalued growth opportunities.
| Company / Index | Trailing PE | Forward PE | PEG | Valuation Spread |
|---|
Screen 2,400+ NSE stocks by forward PEG ratio (< 1.0) and historical 10-year valuation bands in one click.
Upgrade to Pro Desk — ₹2,739/yrHow to Compare PE Ratios in 4 Steps
Select or Enter Stock
Pick a preset (TCS, HDFC Bank, HUL, Maruti) or enter any NSE/BSE company’s financial inputs.
Compare Trailing vs Forward
Evaluate how consensus profit estimates contract the future valuation multiple compared to trailing earnings.
Examine PEG & Growth
Check the Price/Earnings-to-Growth (PEG) ratio to distinguish justified growth premiums from overvaluation bubbles.
Measure Sector Spread
Benchmark the stock’s valuation premium or discount against the 5-year median of direct industry competitors.
The Science of PE Ratio Comparison: Finding Value Without the Value Traps
The Price-to-Earnings (P/E) Ratio is the primary valuation metric used by institutional analysts to determine what the market is willing to pay today for ₹1 of current or future corporate profits. However, analyzing P/E in isolation is inherently flawed: a stock trading at 15x earnings may be dangerously expensive if its industry trades at 10x with declining revenue, while a compounder trading at 35x may represent outstanding value if its growth warrants 45x.
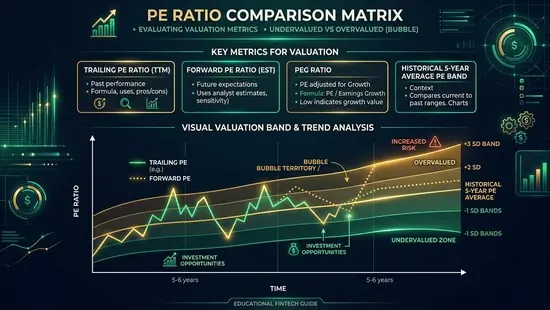
1. Trailing PE (TTM) vs Forward PE
Trailing PE calculates valuation using verified earnings reported over the trailing 12 months. Forward PE uses consensus earnings per share forecasts for the upcoming 12 months. When Forward PE is significantly lower than Trailing PE, the company is projected to grow profits rapidly, compressing valuation over time.
2. PEG Ratio: Growth at a Reasonable Price (GARP)
Popularized by legendary investor Peter Lynch, the PEG Ratio divides the PE ratio by the annual earnings growth rate (PEG = P/E / Growth Rate). A PEG ratio under 1.0 indicates that the stock is undervalued relative to its growth trajectory, offering a margin of safety.
3. Historical Valuation Bands & Sector Medians
Every industry sector operates under distinct return on equity (ROE) economics. FMCG companies command higher multiples (40-60x) due to brand loyalty and negative working capital cycles, whereas Public Sector Banks trade at lower multiples (8-14x) due to cyclical credit costs. True valuation requires sector-normalized peer comparisons.
📋 Regulatory References & Data Sources
- SEBI risk management framework guidelines
- Reserve Bank of India (RBI) financial market benchmark data
- Income Tax Department of India rules & circulars
Disclaimer: This calculator is for educational and planning purposes only. It does not constitute financial advice. Consult a SEBI-registered investment advisor for personalised guidance. Tax rules are updated as per the latest Finance Act — verify with a qualified CA before filing.
Explore Related Stock Fundamental Engines
Relative Valuation Calculator
Benchmark PE, PB, EV/EBITDA, and PS against sector percentiles and industry medians.
PEG Ratio Calculator
Fine-tune Peter Lynch growth at a reasonable price multiples with multi-year CAGR models.
EPS Calculator Online
Calculate basic and diluted earnings per share with preferred dividend adjustments.