Benchmark stock valuation multiples (PE, PB, EV/EBITDA, PS) against Indian sector medians to determine fair market pricing and percentile ranking.
Stock Relative Valuation Screener
Unlock Relative Valuation Pro
Access 10-year historical valuation bands, 5-peer custom comparables, analyst consensus forward ratios, and PDF research exports.
How It Works in 4 Steps
Select Industry Sector
Choose the target sector (IT, Banking, FMCG, Pharma, Auto) to load quarterly median valuation ratios.
Input Per-Share Metrics
Enter current market price, trailing EPS (TTM), forward EPS, book value, and EBITDA per share.
Evaluate Multiples
Compare company valuation ratios against historical industry medians to identify premium or discount.
Review Percentile Rank
Examine percentile position within peer distribution and compute fair value price at sector median.
Understanding Relative Valuation: Multiples in Institutional Context
Relative Valuation values an asset by comparing its price multiples to those of peer companies in the same sector. Rather than predicting 10-year cash flows as in Discounted Cash Flow (DCF) models, relative valuation determines whether a stock is cheap or expensive compared to its industry group today.
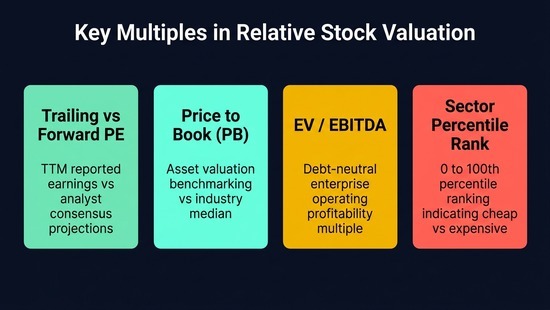
1. Price to Earnings (PE) — Trailing vs Forward
Trailing PE compares price to past 12 months reported earnings. Forward PE incorporates consensus future earnings, revealing whether an apparently expensive stock is actually attractively priced due to rapid profit acceleration.
2. Enterprise Value to EBITDA (EV/EBITDA)
Unlike PE, EV/EBITDA is capital-structure neutral. It accounts for debt obligations and cash reserves, making it the preferred metric for capital-intensive industries like Infrastructure, Metals, and Telecom.
3. Percentile Ranking within Sector
A PE of 30x means very different things across industries: in FMCG it represents a discount, while in Banking it signals an extreme valuation bubble. Percentile ranking standardizes valuation across differing sectors.
📋 Regulatory References & Data Sources
- SEBI risk management framework guidelines
- Reserve Bank of India (RBI) financial market benchmark data
- Income Tax Department of India rules & circulars
Disclaimer: This calculator is for educational and planning purposes only. It does not constitute financial advice. Consult a SEBI-registered investment advisor for personalised guidance. Tax rules are updated as per the latest Finance Act — verify with a qualified CA before filing.
Explore Related Valuation Engines
PEG Ratio Calculator
Adjust PE ratios for expected earnings growth rates to find growth at a reasonable price.
DCF Intrinsic Value Calculator
Project multi-year free cash flows and discount to present value under WACC.
Dividend Discount Model (DDM)
Calculate intrinsic stock value across 1-stage, 2-stage, and 3-stage Gordon growth models.