
Tracking the excel share price requires understanding whether you are evaluating the legacy specialty chemicals producer or the micro-cap infra player. In the Indian stock market, name confusion frequently traps retail participants into buying the wrong counter. Let’s keep it simple and break down the core market dynamics so you can trade with clarity.
Honestly speaking, chemical manufacturing cycles demand patience and deep operational insight. Before deploying your capital, always verify the company fundamentals and historical price behaviour. You can easily evaluate your projected gains using our stock profit calculator to model realistic upside targets.
Decoding Excel Industries vs Excel Realty in the Indian Market
Listen, boss, retail investors often type “Excel” into their broker terminal and purchase whichever ticker appears first. Specifically, Excel Industries Limited trades under the chemical sector on both BSE and NSE, while Excel Realty N Infra represents a micro-cap development enterprise. Because of this distinction, looking at company fundamentals before pressing the buy button is essential.
Excel Industries commands decades of manufacturing heritage across agrochemical active ingredients, biopesticides, and phosphorus specialty chemicals. In contrast, micro-cap realty entities experience volatile low-float price action. For instance, beginners should review essential stock market terms to understand how different exchange listing codes function.
Core Business Drivers Behind Excel Industries Share Price
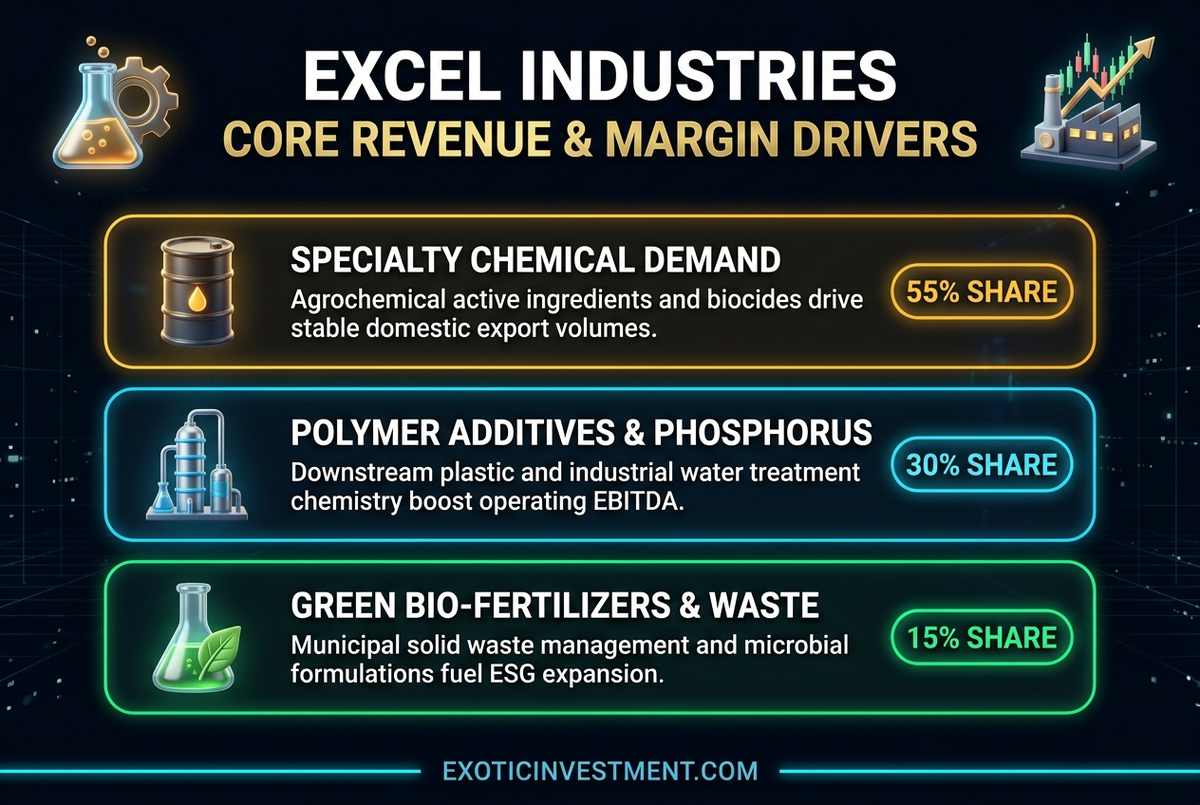
Specialty chemical manufacturers face continuous raw material swings and global demand cycles. When phosphorus prices and crude derivatives fluctuate, chemical margins contract or expand rapidly. Therefore, tracking quarterly gross margin expansion gives you early clues about upcoming earnings surprises.
In addition, domestic agricultural demand directly impacts the agrochemical intermediates division. Good monsoon patterns and stable farm incomes create high demand for crop protection formulations. Consequently, steady order flows support balance sheet strength and sustainable return on capital.
Similarly, polymer additives and industrial water treatment chemicals provide steady operational cash flow. Because these products serve industrial clients, recurring contracts soften agricultural seasonality. You can study these cyclical valuations using our free PE ratio calculator to identify fair entry multiples.
| Evaluation Parameter | Excel Industries Metric | Institutional Action | Desk Outlook |
|---|---|---|---|
| Primary Sector | Specialty Chemicals & Agrochemicals | Monitor Input Costs | Cyclical Growth |
| Exchange Listings | BSE (500650) & NSE (EXCELINDUS) | Check Order Book Depth | Liquid Execution |
| Revenue Diversification | Agrochemicals, Polymers, Waste Mgmt | Track Product Spreads | Balanced Revenue |
| Position Sizing Rule | Maximum 2% to 3% Portfolio Cap | Enforce Hard Stop-Loss | Institutional Safety |
Technical Price Bands and BSE Support Levels
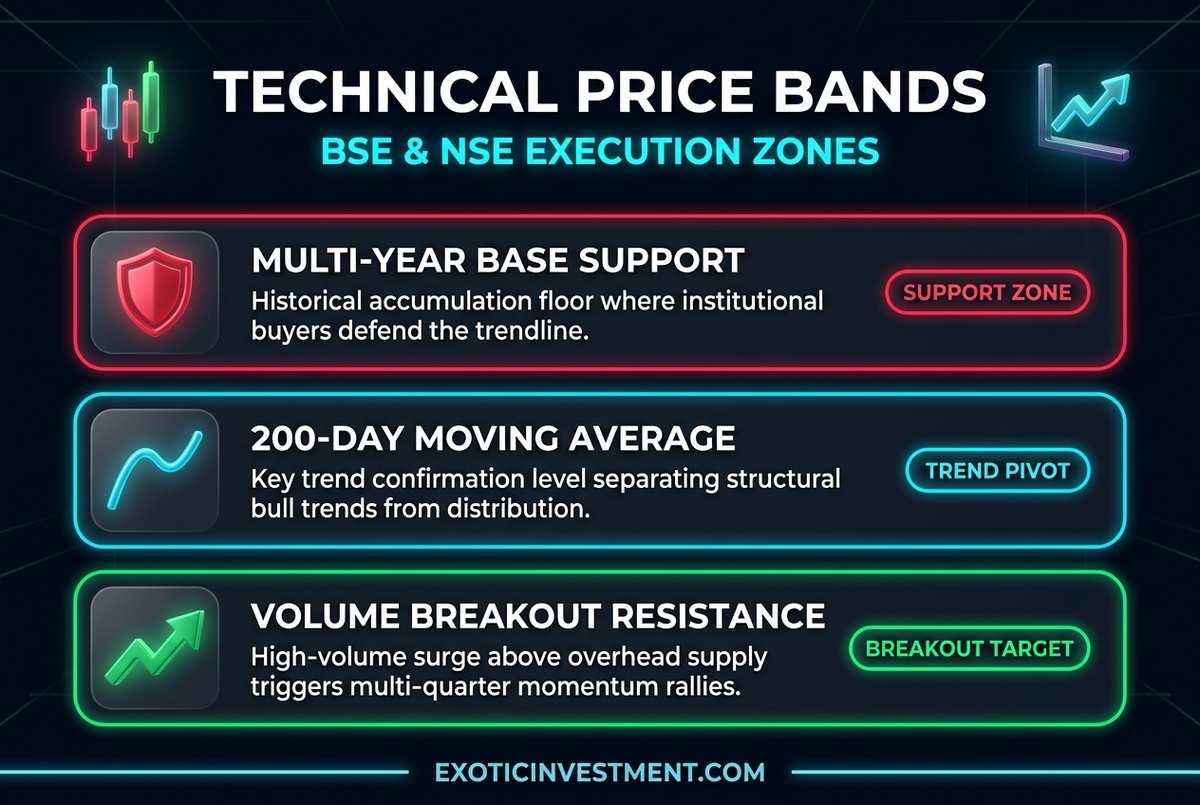
Analyzing technical chart patterns reveals critical price zones where institutional desks accumulate shares. For instance, observing weekly moving averages highlights whether buyers or sellers dominate the market. When prices trade above the 200-day exponential moving average, long-term trends remain structurally bullish.
Conversely, breaking below multi-month support indicates distribution among major holders. Therefore, smart traders wait for confirmed reversal volume before committing fresh capital. In fact, studying how delivery and CNC trading rules work protects you from intraday whipsaws.
Capital Allocation and Risk Management Framework
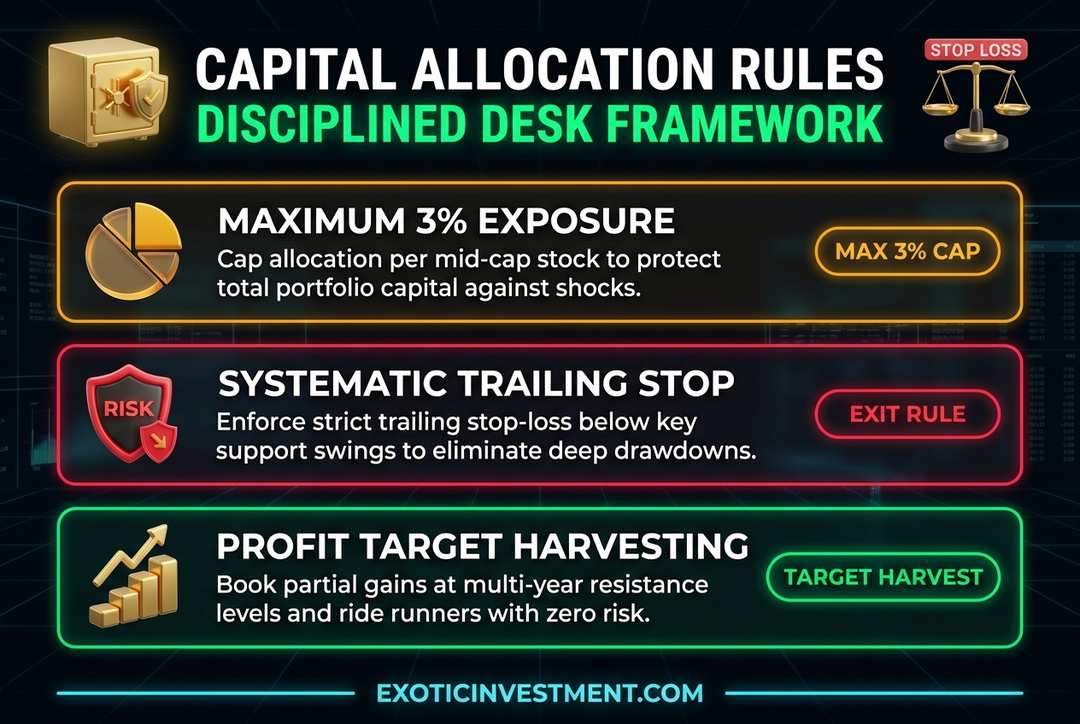
Here is the real deal about building enduring stock market wealth. Successful investing depends on surviving bad drawdowns rather than chasing speculative penny spikes. Because of this principle, our trading desk enforces a strict 3% capital allocation cap on any single mid-cap chemical holding.
In addition, setting automated stop-loss orders prevents a minor market dip from destroying your long-term returns. If a technical trend breaks down, exit cleanly without emotional hesitation. You can systematically model your risk parameters using our dedicated position size calculator before placing market orders.
Additionally, remember to account for brokerage charges, STT, and exchange turnover fees on every transaction. Many retail participants overlook trading costs that eat into net compounding. You can review exact charges across Indian brokers with our Zerodha brokerage calculator.
🚀 Master Global Portfolio Allocation & Compound Wealth
Build an all-weather investment portfolio combining Indian market leaders with global tech compounders. Learn directly from Dr. Ashok Kumar N Rao.
- Master foundational stock market principles with our book Kaliyiri Share Market Book and our English handbook Basics of Indian Stock Market Book.
- Accelerate your research with institutional screeners through the MultiBagger Plus Courses & Pro Tools Annual Subscription.
- Master chart setups by enrolling in our structured Technical Analysis Course in Kannada or options mechanics in our Options Buying Course in Kannada.
Long-Term Wealth Building and Exit Discipline
Ultimately, treating the stock market like a business requires compounding your capital consistently over multiple quarters. Instead of obsessing over daily price noise, focus on quarterly balance sheet updates and industry capex cycles. For instance, long-term investors can project their portfolio trajectory using our SIP calculator online to establish clear financial milestones.
When a stock reaches your fundamental valuation target, harvest partial gains systematically into strength. Never let an unrealized multi-bagger turn into an avoidable loss because of greed. Meanwhile, reinvest your realized profits into diversified assets to keep your financial foundation rock solid.
💡 Frequently Asked Questions (FAQ)
What is the primary difference between Excel Industries and Excel Realty?
Excel Industries is an established specialty chemical manufacturer listed on both BSE and NSE, while Excel Realty N Infra operates as a micro-cap development entity. Always check the official scrip code and examine stock price terms before placing live market orders.
How can investors evaluate Excel share price valuation multiples?
Investors should analyze historical price-to-earnings multiples, operating cash flows, and specialty chemical cycle spreads. You can calculate historical growth metrics easily using our reverse CAGR calculator to determine required earnings expansion.
What circuit limits apply to Excel stocks on Indian exchanges?
Depending on exchange surveillance stages and market capitalization, stocks operate within dynamic 5%, 10%, or 20% price bands. Understand how these mechanisms safeguard retail capital by reviewing our guide on upper and lower circuit limits.
How should traders size their positions when trading chemical stocks?
Disciplined market desks enforce a strict 2% to 3% portfolio allocation limit per stock with predefined trailing stop-losses. Always determine exact trade quantities with our free position size calculator to protect your total wealth.