Reading a live candlestick chart for indian stocks turns messy blinking prices into clear buyer-versus-seller sentiment on NSE. Created in eighteenth-century Japan, candlesticks reveal exact opens, rejections, and closing conviction on every bar. Practice live price reading today inside our live trading chart workspace cleanly.
Wait — why do seasoned Dalal Street traders reject jagged simple line charts right away? Because line plots show only closing dots while hiding intraday traps and institutional absorption! By contrast, every candlestick maps Open, High, Low, and Close cleanly inside your chosen timeframe.
Let us walk smoothly through reading live NSE charts without burying your screen in messy indicators! First, master candle anatomy—real bodies and rejection wicks—in under one minute. Next, pair timeframe discipline with volume confirmation so you spot real institutional accumulation cleanly.
Anatomy of an Indian Stock Candlestick: Open, High, Low, Close
Every bar sitting on a live candlestick chart for indian stocks captures one live auction inside your chosen timeframe. Specifically, the solid colored rectangle called the “real body” connects exact Open and Close prices. Meanwhile, thin vertical lines above and below—”upper and lower wicks”—expose extreme highs and lows tested earlier!
When a share closes higher than its opening price, charts color the body bright green. Conversely, closing below open paints the body crisp red as sellers seize control into close. Watch tall lower shadows closely: they reveal strong demand buying aggressively off cheap intraday dips!
By contrast, tall upper tails expose eager breakout buyers getting trapped beneath stiff overhead resistance! Study full multi-bar structures cleanly inside our day chart guide and chart patterns playbook today.
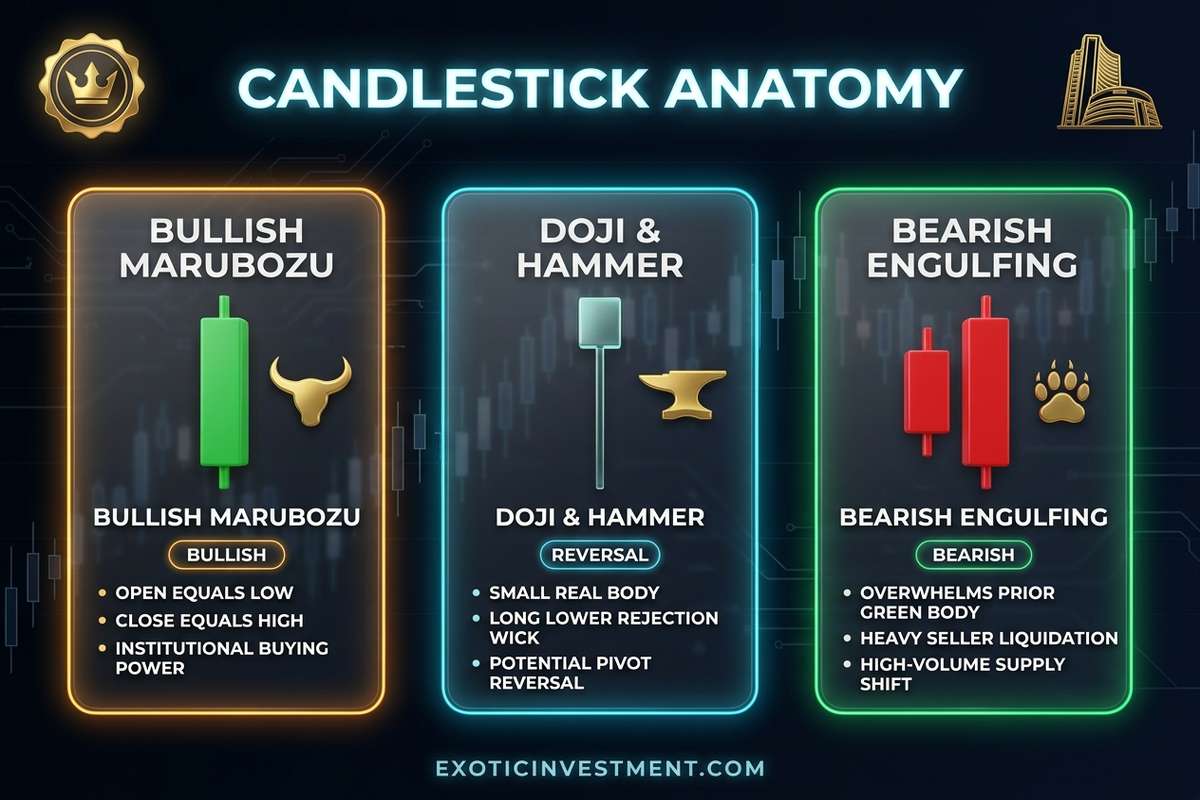
Illustration: Full OHLC anatomy contrasting bullish green buying bodies against bearish red supply bars and upper/lower rejection wicks.
Picking the Right Chart Timeframe for Your Dalal Street Style
Beginners routinely lose clean money because they watch noisy 1-minute candlesticks while planning multi-week swing trades! Picking mismatched timeframes makes harmless institutional breathing look like scary crash breakdowns. Align your chart clock tightly with your actual holding period using three clear tiers.
Fast 5-Minute Charts for Intraday Momentum
Tight 5-minute charts suit active intraday traders catching morning breakouts between 9:20 AM and 3:15 PM IST. Watch opening-range volume bursts alongside key support levels from our pivot point calculator and CPR pivot tracker.
Hourly Charts for Positional Swing Trades
For salaried professionals holding trades one to four weeks, 1-hour and daily charts scrub out noisy noon swings! Waiting patiently for an hourly close above resistance slashes frustrating fake-breakout stopouts dramatically.
Daily and Weekly Charts for Long-Term Wealth
Long-horizon investors compounding across years rely strictly on clean Daily and Weekly candlesticks! Weekly breakouts driven by high turnover often launch steady multi-quarter uptrends—grab visual guides inside our chart patterns PDF resource.
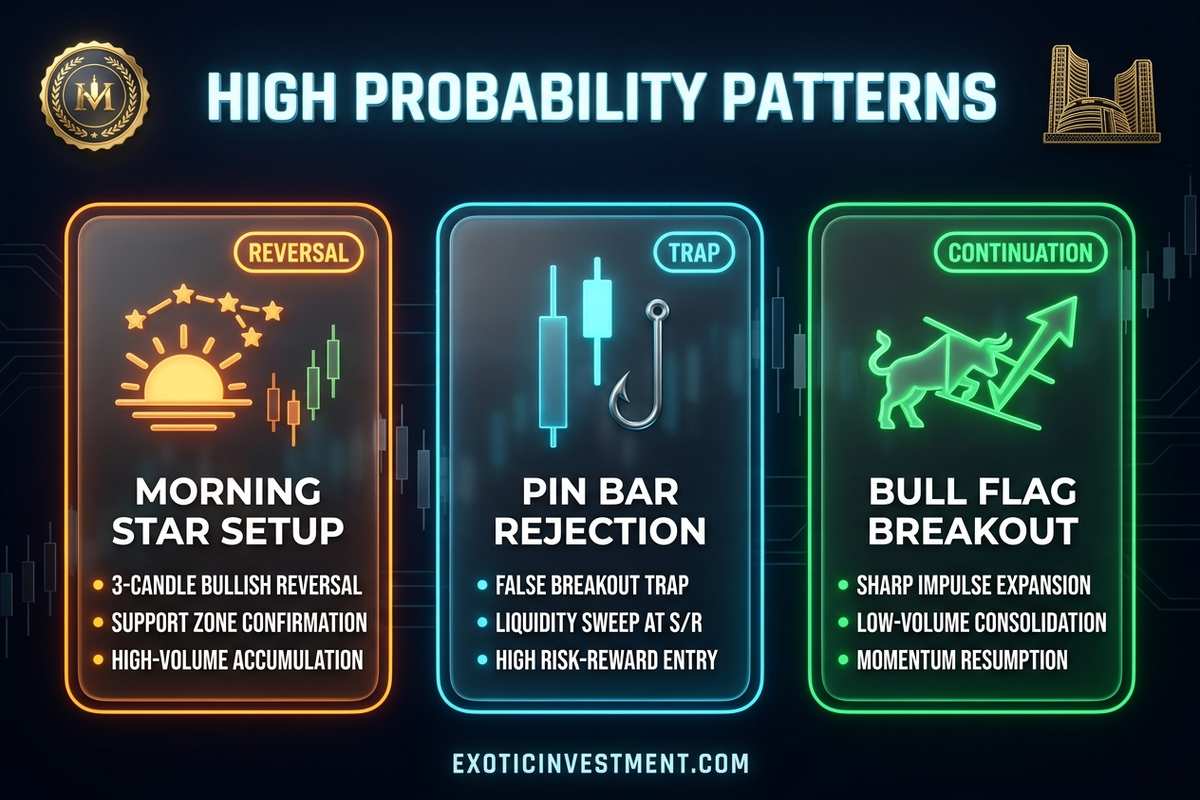
Illustration: High-probability reversal & continuation formations—Hammer, Bullish Engulfing, Morning Star, and Bearish Shooting Star setups.
Chart Style & Timeframe Reference Table for Indian Traders
Keep this crisp trading-desk comparison beside your screen while configuring NSE chart tabs. Selecting matching bar intervals sharpens signal clarity immediately without cluttering candles under ten indicators.
| Trader Profile | Primary Chart & Filter | Must-Watch Confirmation | Primary Advantage |
|---|---|---|---|
| Intraday Momentum Trader | 5-Min & 15-Min OHLC Candles | VWAP + Volume Bar Expansion | Tight intraday stop placement |
| Positional Swing Trader | 1-Hour & Daily Candlesticks | 20 EMA + Horizontal Resistance | Filters noisy algo whipsaws |
| Trend Rider (Heikin-Ashi) | Daily Averaged Heikin-Ashi Bars | Zero upper/lower reverse wicks | Stay calmer inside big moves |
| Long-Term Wealth Investor | Weekly & Monthly Candlesticks | Multi-month base + 200 DMA | Spots 52-week structural breaks |
Worked Setup Math: Trading a ₹500 Hammer Reversal Safely
Never trade a single candlestick shape floating inside random mid-range air! Instead, watch how pros combine strong support zones, closing confirmation, and exact stop sizing on a ₹500 stock. Suppose prices dip calmly across five sessions right into proven ₹495 historical support.
Near session close, a sharp green Hammer prints cleanly with a high body near ₹502 and lower tail sweeping ₹492 on 2.2x volume! Instead of guessing blindly, the disciplined trader enters at ₹503 with a hard stop beneath ₹490—risking exactly ₹13 per share. Targeting clean ₹529 overhead supply locks a crisp 1:2 reward profile!
First check exact share counts using our stop-loss calculator so losses never surpass 1% of account funds. Then confirm total trade sizing calmly via our position size calculator before hitting buy.
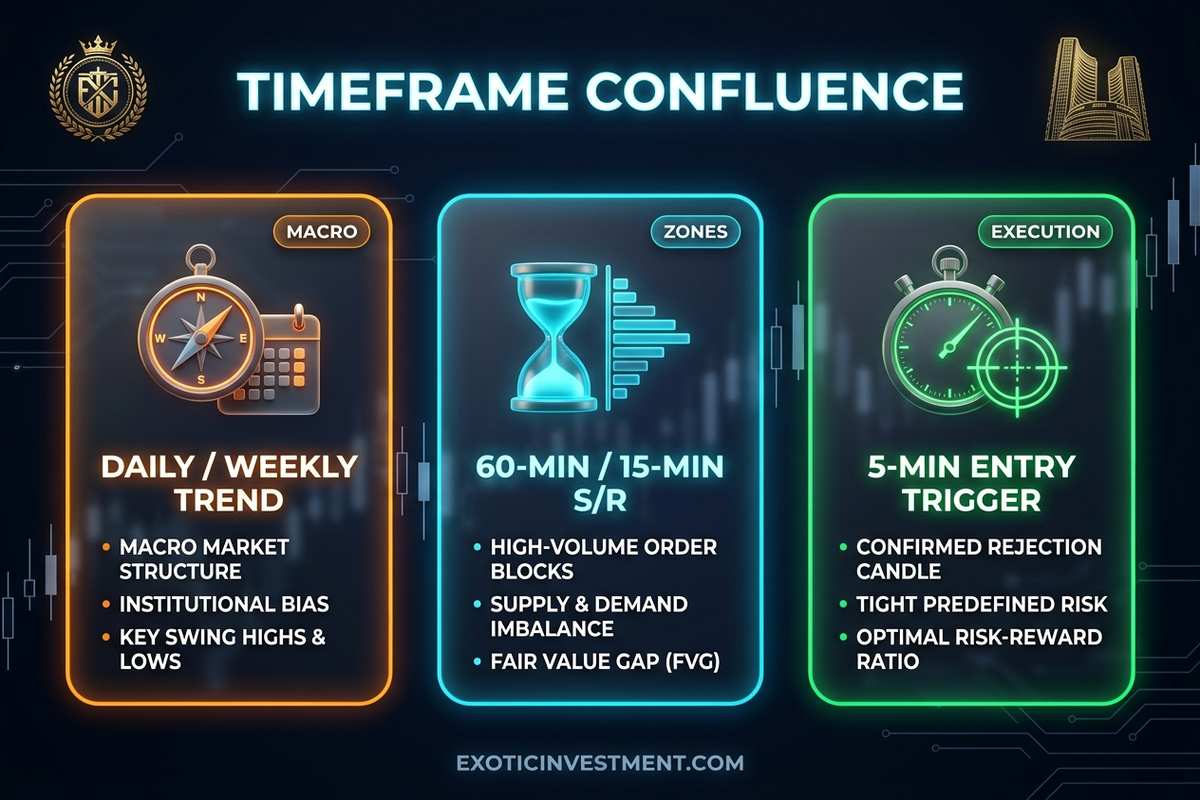
Illustration: Three-step chart confirmation—wait for live candle close, require volume surge above 1.5x average, and anchor entries on key levels.
Reading Volume Bars and Pre-Open Gaps Around Candlesticks
Candles without trading volume resemble silent movies missing soundtracks! Specifically, a giant green breakout bar accompanied by dull below-average turnover frequently stalls quickly within two sessions. By contrast, thick green marubozu bars surging past resistance on 2x–3x average volume reveal genuine institutional participation.
Similarly, notice morning opening gaps between yesterday’s close and today’s 9:15 AM open price! Always verify whether clean trend direction holds using our technical indicators guide and 52-week breakout radar before chasing morning spikes.
Three Golden Rules for Reading Live Charts Without Trap Losses
First, always let the active candle close completely before entering! Why? Because a bright green 15-minute bar at 10:12 AM regularly reverses into an ugly red rejection pin by 10:15 AM.
Second, respect broader higher-timeframe trends instead of shorting roaring bull leaders solely on one tiny red bar! Finally, inspect free charts regularly on our live trading workspace and study our Kannada candlestick tutorial anytime.
Top Four High-Probability Candlestick Patterns on NSE Charts
When reading a live candlestick chart for indian stocks, skip memorizing fifty confusing textbook names! Instead, master four clean price-action footprints anchored around proven support and resistance zones cleanly. First stands the Bullish Engulfing bar, where strong buying completely swallows yesterday’s red panic candle.
Second, spot classic Morning Star three-bar reversals printing quietly after prolonged multi-week sector selloffs! Specifically, a tiny indecisive Doji pause between steep selling and urgent heavy buying reveals exhausted supply clearly. Third, watch tall Shooting Star upper wicks rejecting stubborn overhead supply near multi-month resistance ceilings!
Fourth, track tight Inside Bar compression clusters coiled closely beneath 52-week price breakouts cleanly. As a result, clean directional breaks out of tight Inside Bars often spark swift institutional momentum runs! In addition, verify breakout health rapidly using our momentum stock screener and EMA crossover scanner today.
Meanwhile, always inspect sector leadership before acting on isolated single-stock candlestick signals! For example, even pristine bullish bars frequently stall when broad sector peers slide downward simultaneously. Check broad index rotation anytime inside our sectoral momentum tracker cleanly.
Finally, keep clean charts uncluttered so genuine price and volume action stays crystal clear during fast opening hours! Instead of crowding ten bright oscillators onscreen, mark key weekly supply zones accurately beforehand.
🚀 Trade Clean Dalal Street Setups With Institutional Discipline
Stop squinting at noisy chart clutter. Read clean live price action alongside Dr. Ashok Kumar N Rao and our 1,300+ active trading community.
- Strengthen trading rules via our Kaliyiri Share Market Book and English bestseller Basics of Indian Stock Market Book.
- Access institutional screeners and pro chart tools via the MultiBagger Plus Courses & Pro Tools Annual Subscription.
- Master live charts deeply in our Technical Analysis Course in Kannada or option entries in our Options Buying Course in Kannada.
💡 Frequently Asked Questions (FAQ): Live Candlestick Chart for Indian Stocks
1. Where can I view a free live candlestick chart for indian stocks?
You can inspect real-time NSE candlesticks directly inside regulated broker apps or our free live trading chart workspace! Explore clean daily setups anytime inside our day chart guide too.
2. Which candlestick timeframe works best for beginners on NSE?
Daily and 1-hour candlesticks give beginners far cleaner trend signals by scrubbing out 1-minute algo noise! Scan smooth higher-timeframe setups cleanly with our live EMA crossover screener anytime.
3. What does a long wick above or below a candlestick indicate?
Long lower wicks prove eager buyers rescued cheap dips, whereas tall upper shadows expose stiff overhead selling resistance! Pair rejection wicks tightly with pivot point levels beforehand.
4. Should I buy immediately when a Hammer forms halfway through a candle?
No — never enter on an unclosed forming candlestick! Wait patiently until the timer finishes and keep hard stops via our stop-loss calculator cleanly.
5. How are Heikin-Ashi bars different from standard NSE candlesticks?
Standard bars plot exact real fills, whereas Heikin-Ashi averages prior bars visually to smooth bumpy trend pullbacks! Learn pure chart shapes first inside our chart patterns guide cleanly.
6. Can candlestick patterns predict earnings surprises or RBI policy shocks?
Wait — technical charts show public positioning rather than secret earnings surprises ahead! Cut overnight position size calmly ahead of policy announcements using our position size calculator cleanly.