
Studying highest pe stocks in india teaches market learners why triple-digit Price-to-Earnings multiples hide both rare winners and painful valuation traps. Whenever investors sort stock screeners by high P/E ratios, knowing *why* buyers pay ₹100+ per ₹1 of earnings prevents costly mistakes. Today, explore our educational valuation framework alongside the PE ratio calculator cleanly.
First, recognize an important mathematical nuance before reading any stock screener! Extreme P/E ratios like 90x or 250x happen for three completely opposite reasons on Dalal Street. Specifically, they signal temporary earnings troughs, rapid compounding growth, or dangerous retail hype bubbles!
Let us inspect this educational framework so you can analyze rich multiples independently without rumor tips. First, separate depressed cyclical earnings spikes from genuine quality moats. Next, test PEG sustainability, capital efficiency, and derating risks before risking household savings.
Three Structural Reasons Stocks Display Extreme P/E Multiples
Whenever screens show the highest pe stocks in india, never jump straight to conclusions! Mathematically, P/E equals Share Price divided by Trailing 12-Month Earnings Per Share (EPS). Consequently, a shrinking EPS denominator shoots headline P/E ratios skyward overnight even while share prices stay flat!
Category A — Quality Monopoly Moats and Consumer Compounders
Certain debt-free consumer brands trade between 50x and 80x P/E year after year across market cycles. Institutions tolerate rich multiples here because cash flows stay predictable with tiny factory spending needed. Verify whether steady margins defend high multiples inside our operating margin explainer anytime.
Category B — Turnaround and Cyclical Earnings Troughs
Surprisingly, heavy manufacturing, aviation, and chemical stocks often hit 150x to 500x P/E near recession bottoms! Why? Temporary profit dips toward break-even shrink trailing EPS dramatically just before demand recovers.
Therefore, blind P/E sorting misleads beginners during cyclical turnarounds! Test trailing EPS sensitivity accurately via our EPS online calculator cleanly.
Category C — Speculative Hype and Thin-Float Bubbles
Unfortunately, many illiquid smallcaps trade past 100x P/E purely on narrative buzz and tight promoter holdings! Once early insiders sell shares into retail excitement, sudden P/E compression routinely slashes share prices by 50% to 80%. Check whether exchanges flagged abnormal volatility inside our ASM and GSM guide first.

Illustration: Three distinct causes behind triple-digit P/E multiples—predictable quality moats, depressed cyclical EPS, and speculative liquidity bubbles.
Quality Moats vs Growth Traps: Analytical Framework Table
Use this objective evaluation table whenever auditing high-multiple industries across NSE and BSE sectors. Dividing durable cash generators from fragile narratives shields portfolios from brutal derating drops.
| Checklist Filter | Durable High-P/E Compounder | Cyclical Trough Spike | Fragile Valuation Trap |
|---|---|---|---|
| Return on Capital (ROCE) | 22% to 45%+ consistently | Low today, recovering toward norm | Weak (< 10%) despite hype |
| Free Cash Flow (FCF) | Positive & funding dividends | Capex heavy, turns positive soon | Chronic negative cash flow |
| Forward 2-Yr P/E | Compresses smoothly via growth | Drops sharply as EPS normalizes | Remains inflated (> 80x forward) |
| Margin of Safety | Moderate — zero room for misses | Requires deep sector expertise | Zero cushion — extreme crash risk |
| Investor Rule of Thumb | Accumulate gradually on dips | Price normalized EV/EBITDA | Strictly avoid tip-driven chasing |
Worked Compression Math: Why High P/E Demands Relentless EPS Growth
Let us test hypothetical numbers on a pricey 80x P/E stock trading at ₹800 on ₹10 trailing EPS! Suppose the business grows annual EPS smoothly at 25% compound yearly over three straight years. Consequently, Year 3 EPS rises impressively from ₹10 to ₹19.53!
Now inspect the hidden risk when market mood cools from 80x down toward a normal 35x multiple! Multiply ₹19.53 EPS by 35x, and fair value drops to ₹683—still 14.6% below your ₹800 cost despite brilliant growth! Therefore, verify P/E vs PEG compression math and peer spreads in our PE comparison tool before entering.
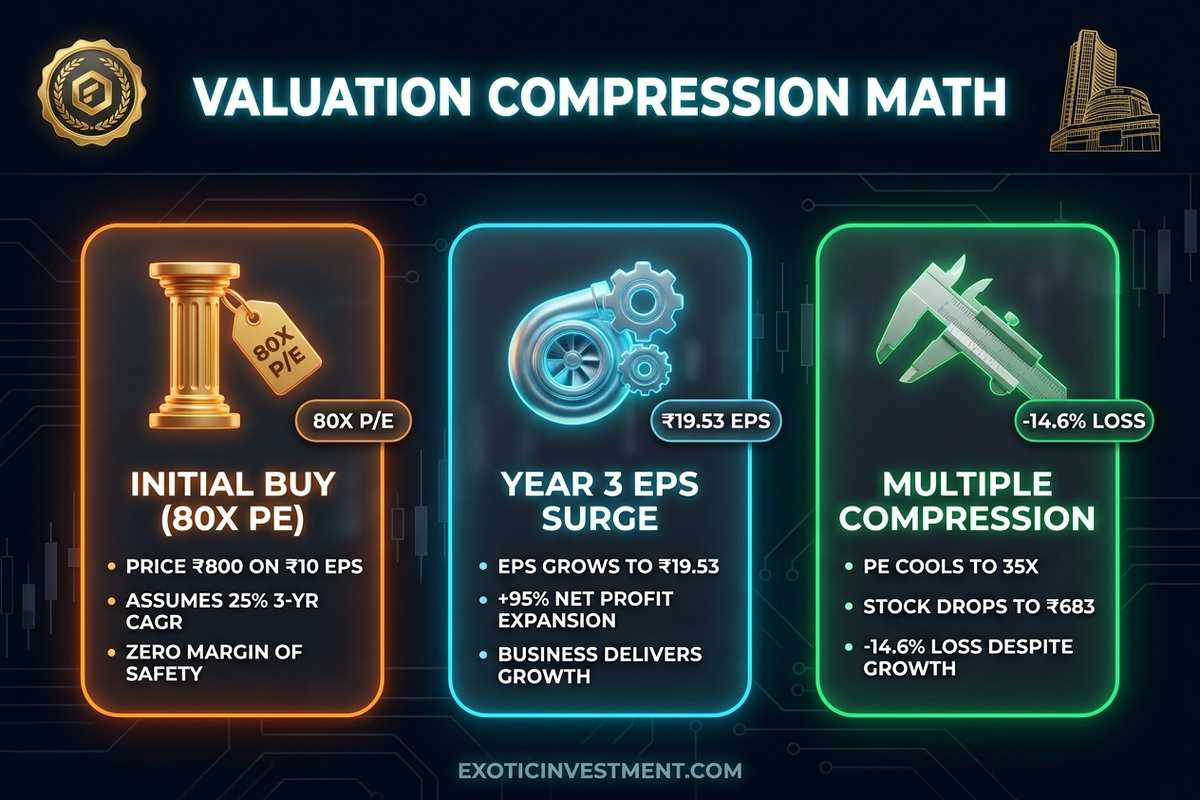
Illustration: Valuation compression math proving how multiple contraction from 80x to 35x offsets strong underlying EPS growth.
Four Quantitative Safeguards Before Auditing Richly Valued Leaders
Does every high-P/E company collapse eventually over long cycles? Definitely not! Decades of Indian equities prove rare asset-light leaders compound smoothly from elevated multiples when cash returns stay exceptional.
However, disciplined analysts demand strict numerical checks before studying rich valuations. First, test fair intrinsic range carefully inside our DCF valuation calculator using modest exit assumptions. Second, confirm quarterly revenue and operating cash flow expand together rather than stacking unpaid bills, while checking FII accumulation via our FII DII data tracker.
Finally, size every equity ticket strictly so one unexpected quarterly earnings miss cannot wreck family savings! Run multi-factor peer checks calmly inside our relative valuation tool and position size calculator beforehand.
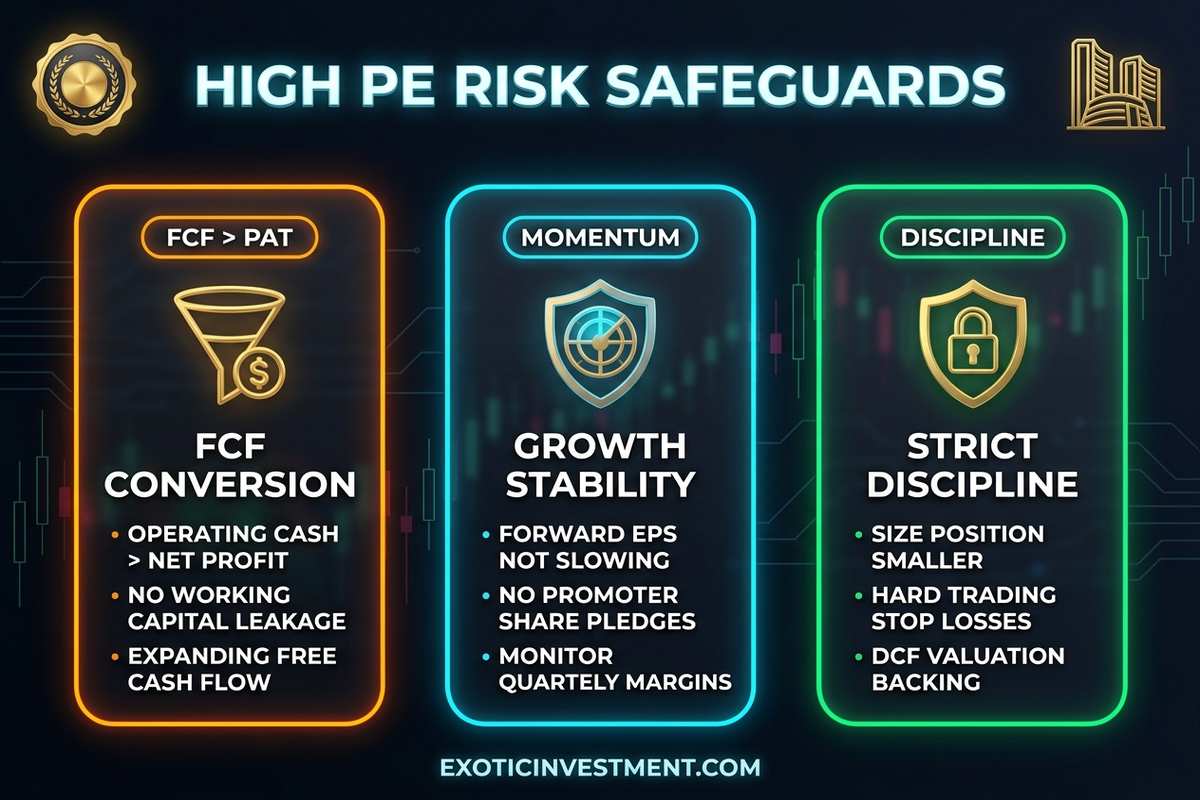
Illustration: Professional risk checklist auditing FCF conversion, forward EPS deceleration, and strict stop-loss discipline on high-P/E names.
Institutional Warning Signs: Detecting Bubble Pricing Early
Studying highest pe stocks in india safely requires spotting early narrative fatigue before sharp drawdowns begin! Specifically, watch carefully when corporate sales growth slows from 35% toward 12% while stock multiples remain locked above 90x earnings. Whenever growth decelerates underneath lofty valuations, institutions trim exposure steadily ahead of retail buyers.
In addition, monitor promoter share pledges and sudden key-executive resignations inside quarterly exchange disclosures! For instance, rising promoter collateral pledges often force abrupt market selling during broad Nifty corrections. Always review ownership stability via our promoter pledging guide first.
Above all, compare high-multiple darlings against slower, profitable sector peers trading at reasonable multiples! Sometimes, owning the number-two business at one-third the valuation provides superior downside safety. Calculate risk-adjusted return hurdles inside our stock return calculator and verify daily momentum calmly via our momentum stock screener today.
Handling High-P/E Volatility Using Disciplined Risk Controls
Even genuine market leaders carrying 75x multiples regularly endure painful 25% to 35% price pullbacks! Therefore, beginners chasing extended breakouts without hard stop levels suffer severe emotional panic fast. Instead, size volatile names far smaller than steady dividend blue chips.
Similarly, verify exact downside loss ceilings before placing any delivery or positional cash order! Run precise risk allocations inside our stop-loss calculator so portfolio health stays unshaken. Therefore, disciplined sizing keeps sudden high-multiple swings manageable without hurting long-term confidence.
First, refuse to average downward blindly whenever a triple-digit multiple company breaks multi-month weekly support! Instead, wait calmly for quarterly cash-flow recovery and institutional demand confirmation before rebuilding equity stakes. Second, compare historical sector valuation ranges cleanly via our PE valuation explainer so cyclical hype never clouds objective judgment.
Above all, remember steady portfolio wealth comes from consistent reasonable entry pricing paired with enduring earnings and free cash momentum! Therefore, treat lofty valuation multiples purely as early caution lights prompting deeper forensic balance sheet inspection before risking household savings.
🚀 Trade Clean Dalal Street Setups With Institutional Discipline
Stop chasing expensive stock rumors blindly. Learn objective valuation cleanly alongside Dr. Ashok Kumar N Rao and our 1,300+ active trading community.
- Build solid analysis skills via our Kaliyiri Share Market Book and English bestseller Basics of Indian Stock Market Book.
- Access institutional screeners and research tools via our MultiBagger Plus Courses & Pro Tools Annual Subscription.
- Pair fundamental discipline with clean charts in our Technical Analysis Course in Kannada or Options Buying Course in Kannada.
💡 Frequently Asked Questions (FAQ): Highest PE Stocks in India
1. Why do screeners show certain highest pe stocks in india above 200x?
Triple-digit P/E ratios appear either when temporary profit dips shrink trailing EPS or when buyers expect hyper growth! Study core valuation math cleanly inside our PE ratio valuation guide today.
2. Are high P/E ratio stocks always overpriced and risky to touch?
Wait — not automatically! Rare debt-free franchises compounding above 25% yearly sometimes outperform even from rich P/E tags; verify growth balance via our PEG ratio calculator first.
3. How do I check if a high P/E stock is actually a dangerous trap?
Inspect three quick warnings: stagnant cash flows, slowing quarterly sales, and extreme premiums above close industry competitors! Compare direct peer multiples via our PE comparison tool upfront.
4. What happens to a high P/E stock if one quarterly result disappoints?
Richly valued shares leave zero safety buffer, so tiny 5% profit misses often spark sharp 25% multiple drops! Cap position exposure cleanly using our position size calculator beforehand.
5. Which alternative ratios work better when P/E looks distorted or negative?
When trailing profits dip temporarily, analysts examine EV-to-Sales, Price-to-Book, and normalized EV/EBITDA instead! Test peer valuation factors smoothly via our relative valuation calculator right now.
6. Does SEBI ever restrict volatile low-float high P/E stocks?
Yes — Indian exchanges move erratic low-float stocks showing extreme P/E spikes into stricter margin and price bands! Track surveillance frameworks closely inside our ASM and GSM guide today.