
Asking honestly is stock market profitable marks the smartest first step before risking household money on Dalal Street. Social feeds blast green intraday profit screenshots daily while hiding steep SEBI loss numbers. Today, compare mathematical investing facts against short-term trading myths inside our SEBI intraday trading reality report.
Here is the blunt truth gathered from twelve years watching real Indian broker ledgers! Yes, patient long-term equity investing has generated enormous tax-efficient family wealth across 10-to-25-year horizons. Conversely, SEBI studies confirm over 90% of individual F&O traders lose net cash after brokerage and taxes!
Why do calm investors compound wealth cleanly inside the exact same NSE ecosystem where hyperactive gamblers fail? First, examine long-term return probabilities behind Nifty 50 investing across market cycles. Next, uncover the exact brokerage drag, emotional traps, and position limits separating winners from losers.
The Brutal SEBI Truth: Long-Term Investing vs Short-Term Trading
Many beginners ask is stock market profitable assuming NSE behaves like one giant lottery wheel! In reality, Dalal Street hosts two opposite games under identical tickers. One rewards patience alongside growing earnings; the other pits you against fast institutional algorithms.
Why 93% of Retail F&O and Hyper-Intraday Traders Lose Money
SEBI’s September 2024 empirical study tracked millions of individual derivative traders across fiscal years 2022–2024. Shockingly, 93% of individual F&O participants suffered net losses exceeding ₹2 lakh on average! Meanwhile, proprietary trading desks and institutional hedgers captured most net gains cleanly.
Even worse, transaction taxes and brokerage ate roughly 26% on top of direct trading losses! Review realistic daily market income math calmly inside our daily earning realities guide before scalping weekly options.
Why Patient Equity Holders Compound Wealth Consistently
Flip that timeframe toward patient 5-to-15-year Indian delivery investors and probabilities reverse dramatically! Historically, India’s Nifty 50 Total Return Index delivered 12% to 14% annualized returns over rolling 10-year spans. Specifically, multi-year corporate profit growth drives steady returns despite temporary wars, recessions, and crashes.
Consequently, disciplined savers who stay invested beat inflation and fixed deposits comfortably over decades. Model realistic multi-year compounding cleanly inside our stock return calculator and SIP wealth calculator anytime.
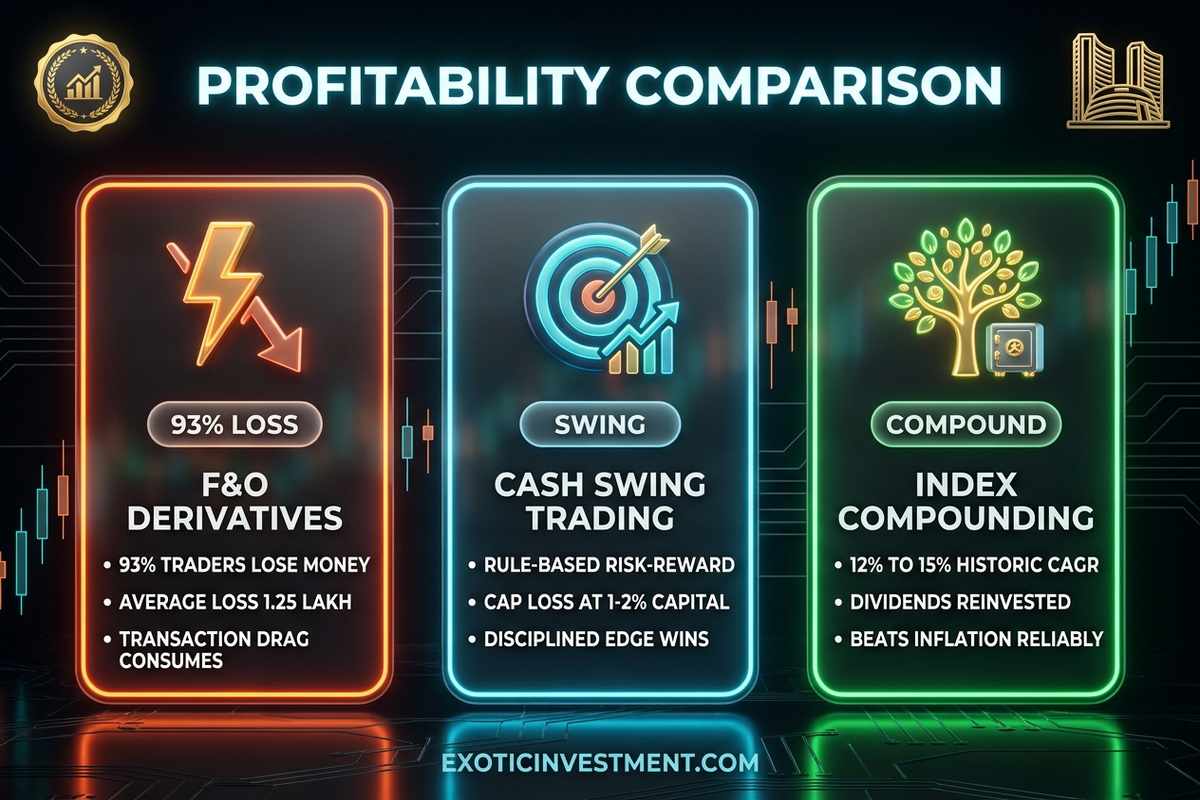
Illustration: Contrasting probability profiles across hyper-short F&O trading (93% loss rate), structured swing trading, and long-term compounding.
Timeframe Comparison Table: Profitability Odds Across Indian Market Styles
Inspect this objective strategy scorecard carefully before picking your primary market lane! Notice clearly how holding longer slashes fee drag and raises real retail success odds.
| Market Approach | Typical Holding Period | Cost & Tax Drag | Retail Success Probability |
|---|---|---|---|
| Intraday & Weekly Options | Minutes to few hours | Extreme brokerage, STT & 30% tax | Very Low (< 7% consistent) |
| Disciplined Cash Swing Trading | 2 Weeks to 4 Months | Moderate fees + 20% STCG tax | Moderate (with strict stop-loss) |
| Quality Direct Equity Portfolio | 3 to 10+ Years | Minimal churn + 12.5% LTCG | High (with earnings discipline) |
| Nifty 50 / Index SIP Investing | 7 to 20+ Years | Ultra-low TER + ₹1.25L tax exemption | Historically Near 100% (10y+) |
Worked Compounding Math: ₹10,000 Monthly SIP vs Active Churn
Let us compare pure Indian household math between two savers investing ₹10,000 every month! Saver A chases frequent intraday moves across 500 trades yearly, bleeding roughly ₹45,000 annually in fees and taxes. Meanwhile, Saver B automates ₹10,000 monthly into diversified Nifty 50 index funds earning 13% annualized.
Over twenty patient years, Saver B invests ₹24,00,000 total cash and builds roughly ₹1.14 crore! On the other hand, Saver A suffers stress, margin drawdowns, and 30% short-term tax slabs. Calculate step-up targets cleanly inside our step-up SIP calculator and lumpsum calculator today.
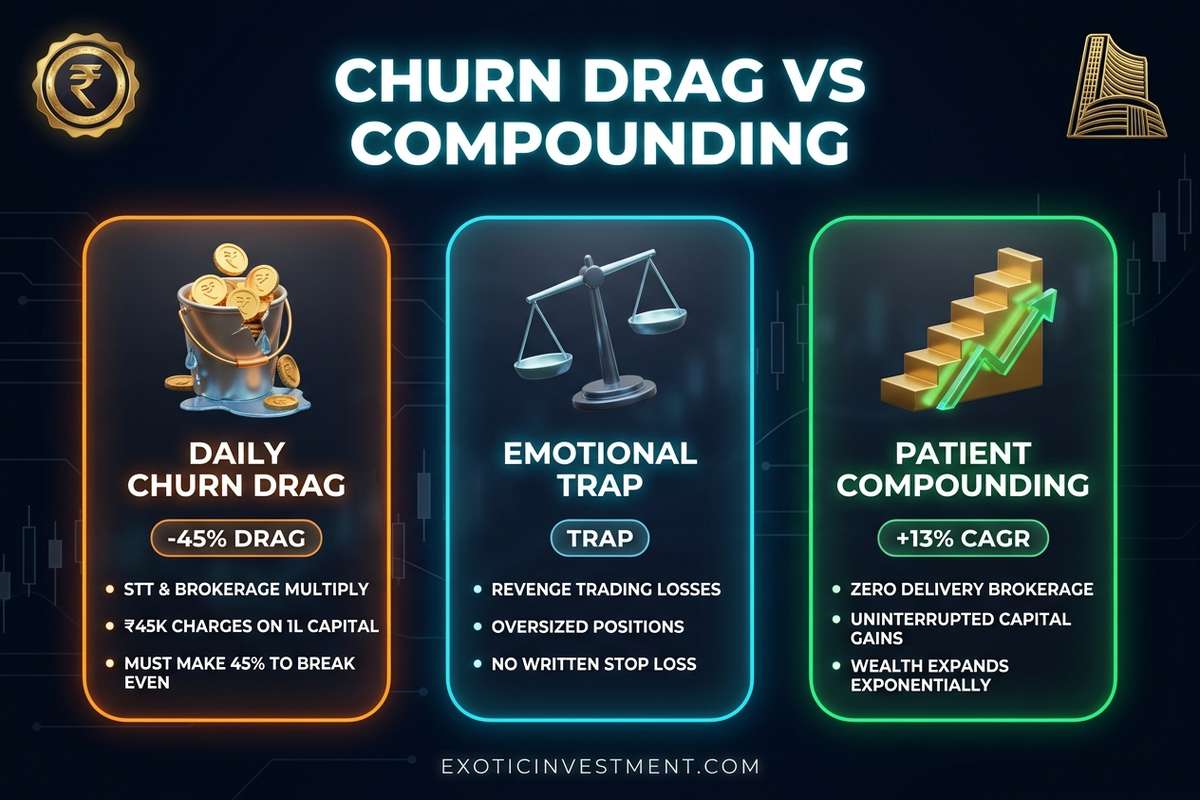
Illustration: Cumulative drag from excessive brokerage, slippage, and short-term taxes compared against long-horizon equity compounding.
Over-Trading Fee Drag: How Small Costs Quietly Sink Traders
Wait — why do active scalpers with a 55% win rate still finish negative at financial year-end? Notice what happens mathematically across ₹1,00,000 trading capital spun twice daily! Even tiny ₹90 round-trip charges across brokerage, STT, exchange fees, and stamp duty drain ₹45,000 per year.
That hidden friction forces you to generate a massive 45% gross return just to reach break-even! Check exact contract note charges before spinning small capital inside our Indian brokerage calculator and order slippage calculator cleanly.
Four Pillars That Make Stock Investing Consistently Profitable
Whether you hold index allocations or run structured cash swing setups, winning participants follow four identical habits! Dropping even one habit leaves savings exposed during sudden market selloffs.
First, cap single-trade risk strictly via stop-loss sizing so one bad gap-down never wipes out months of work. Compute safe quantities instantly inside our position size calculator. Second, ignore shady WhatsApp rumors pushing stocks locked under exchange ASM watchlists.
Third, keep six months of family expenses parked safely in liquid debt before buying shares. Finally, review losing trades calmly using our loss recovery guide and stop-loss calculator every Sunday.

Illustration: Core risk-management habits—emergency reserves, strict position sizing, zero tip-chasing, and multi-year patience.
Realistic Capital Milestones: From ₹1 Lakh to Sustained Wealth
Asking is stock market profitable makes complete sense when families protect hard-earned savings from inflation! Unfortunately, unrealistic social media expectations tempt beginners into risking ₹1,00,000 for instant monthly salaries. In reality, demanding 10% every month almost always forces dangerous borrowing and painful account wipeouts.
However, treating markets as a business changes your entire emotional experience! Specifically, pairing regular monthly savings with steady 12% to 15% portfolio growth rewards patient Indian families richly. First, master compounding timelines inside our reverse CAGR calculator so target goals feel concrete.
Next, diversify across solid large-cap businesses instead of betting half your savings on one hot story stock! In addition, track institutional foreign and domestic buying calmly via our FII DII data tracker before adding fresh cash. Consequently, staying calm across bumpy market winters locks in true long-term gains.
Why Paper Trading and Risk Journaling Build Real Market Edge
Before committing real lakhs onto volatile cash swings or options, practice strictly with honest records! For example, spend sixty market sessions tracking simulated entries, exit targets, and exact brokerage slips calmly. As a result, beginners spot costly impatience habits cleanly without losing one rupee of household savings.
Therefore, judge every setup by disciplined risk-reward ratios rather than lucky single-day outcomes! Compute realistic win-streak drawdowns early using our Monte Carlo portfolio simulator and check downside exposure inside our Value at Risk calculator today.
In addition, remember steady patience rewards calm investors who ignore noisy daily television commentary and hype completely! When quality large-cap earnings compound steadily across growing Indian economic cycles, lasting multi-year portfolio wealth follows naturally. Consequently, boring written rules quietly outperform flashy daily tips over every ten-year market stretch.
🚀 Trade Clean Dalal Street Setups With Institutional Discipline
Stop donating money to transaction drag and impulse trades. Join the profitable minority alongside Dr. Ashok Kumar N Rao and our 1,300+ active trading community.
- Build unshakeable habits via our Kaliyiri Share Market Book and English bestseller Basics of Indian Stock Market Book.
- Access institutional screeners and pro tools via the MultiBagger Plus Courses & Pro Tools Annual Subscription.
- Learn price action in our Technical Analysis Course in Kannada or disciplined rules in our Options Buying Course in Kannada.
💡 Frequently Asked Questions (FAQ): Is Stock Market Profitable
1. Honestly, is stock market profitable for Indian beginners?
Yes — long-term delivery and SIP investors beat inflation reliably over 7-to-15-year spans, whereas 93% of F&O traders lose money. Read exact SEBI stats inside our intraday profitability report today.
2. Why do so many people still lose money in NSE and BSE stocks?
Most beginners over-trade with borrowed margins, hold deep losers without stops, and chase hyped tips at market peaks. Compute strict risk caps upfront using our position size calculator cleanly.
3. What realistic annual return should long-term equity investors expect?
Historically, diversified Indian large-cap portfolios deliver roughly 12% to 15% annualized returns across full market cycles. Model realistic long-term wealth curves inside our stock return calculator anytime.
4. Can someone earn a reliable daily salary solely from day trading?
Wait — demanding fixed daily payouts from choppy market sessions triggers reckless over-trading on flat afternoons! Read trade-desk rules carefully inside our daily market realities guide first.
5. How much starting money do I need to invest profitably in India?
You can start equity index SIP investments with ₹500 monthly through regulated SEBI brokers without large upfront lump sums. Verify brokerage drag on smaller tickets inside our Indian brokerage calculator right now.
6. How should I react if my equity portfolio sits red during a market crash?
Never panic-sell strong profitable companies merely because macro news turns scary for six months! Study proven crash survival steps inside our market crash survival guide beforehand.