
Learning how to spot undervalued stocks helps Indian investors avoid buying expensive hype at bull market peaks. During temporary macro fear, strong profitable businesses frequently trade well below intrinsic cash value. Today, master seven valuation filters inside our relative valuation calculator cleanly.
Wait — why does a ₹15 penny stock often turn out ten times pricier than a ₹3,500 industry leader? Because nominal share price never reveals true corporate valuation! Instead, undervaluation compares current enterprise price directly against sustainable Free Cash Flow.
Let us apply seven proven institutional screens used daily across NSE equity desks. First, pair P/E and PEG ratios against five-year industry norms cleanly. Next, verify balance sheet debt safety and operating cash conversion so you dodge hidden value traps!
Why Low Share Price Never Means Undervalued Stock
New Dalal Street traders routinely filter screeners for tiny shares under ₹50 expecting effortless double gains. Sadly, weak penny companies often suffer shrinking revenue, crushing loans, and poor governance. Meanwhile, a ₹2,500 market leader earning growing profits can sit deeply undervalued at 14x earnings!
Real analysts ignore unit ticket price completely and study total market capitalization versus cash profit instead. Above all, compare a firm strictly against its own five-year valuation median and sector rivals. Check basic multiples cleanly inside our PE ratio valuation guide and PE ratio calculator.
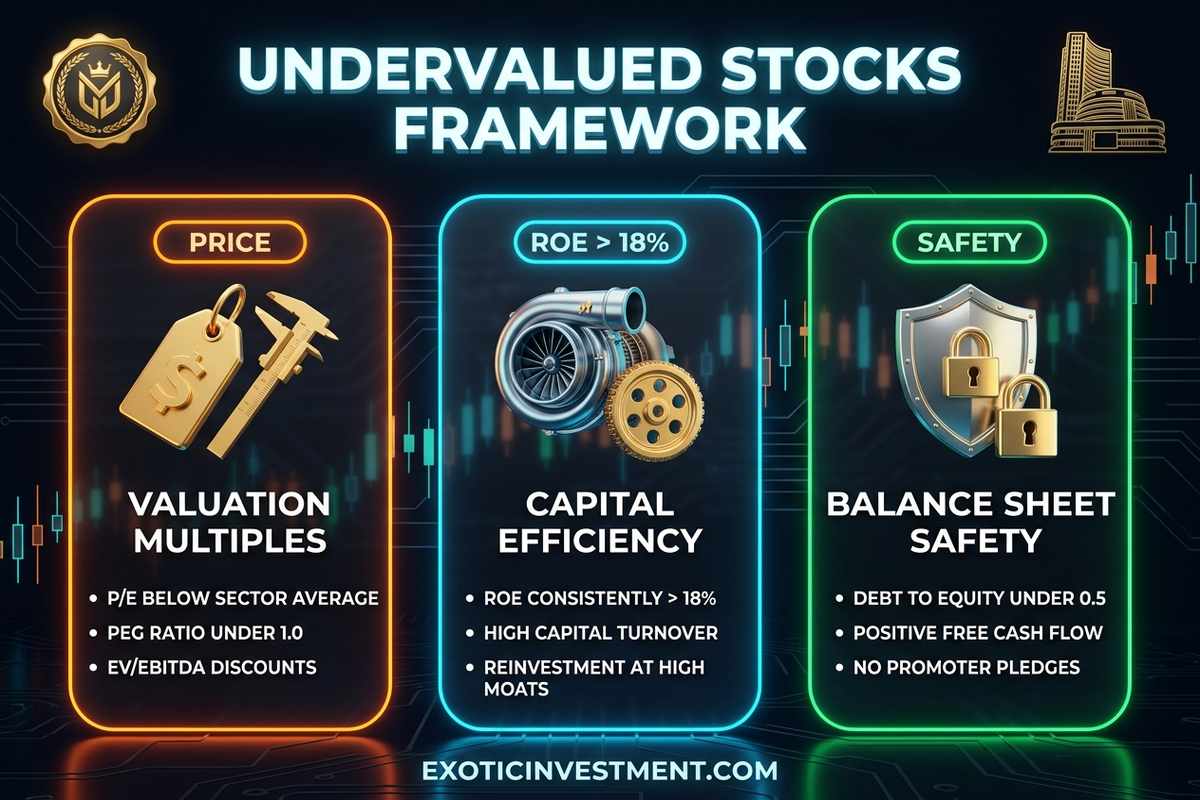
Illustration: Three-pillar undervaluation screening combining earnings multiples, capital efficiency (ROE), and balance sheet debt safety.
The 7 Institutional Ratios for How to Spot Undervalued Stocks
Never depend on a single financial ratio when hunting equity bargains on NSE and BSE! Specifically, pairing earnings multiples with balance sheet efficiency builds an iron shield against cyclical traps. Apply these seven core checkpoints cleanly on every prospect.
Filter One — Price-to-Earnings Below Historical and Sector Median
First, compare trailing P/E directly against the stock’s five-year median and direct industry competitors. For example, suppose a quality consumer firm normally commands 25x P/E yet trades near 15x today. Immediately verify multi-peer spreads using our PE comparison tool cleanly.
Filter Two — PEG Ratio Below 1.0
Next, fast-expanding midcaps rarely print single-digit P/E tags even while genuinely cheap! Divide trailing P/E by expected annual EPS growth to compute the PEG Ratio cleanly. Generally, scores below 1.0 show fair growth discounts—test numbers via our PEG ratio calculator.
Filter Three — Price-to-Book Paired With Return on Equity
Book value carries heavy weight across banks, NBFCs, cement factories, and capital-heavy producers. Specifically, low P/B paired with steady ROE above 15% confirms clean asset productivity! Conversely, low P/B alongside weak 4% ROE usually signals idle value destruction.
Filter Four — Enterprise Value to EBITDA Clarity
Whereas P/E ignores corporate debt, EV/EBITDA adds net borrowings directly onto equity value! Consequently, debt-laden manufacturers reveal true pricing clearly under EV/EBITDA filters. Aim for multiples sitting noticeably below five-year sector norms while margins hold firm.
Filter Five — Debt-to-Equity Safety and Interest Coverage
Cheap equity wipes out holders fast if rising rates squeeze heavily indebted balance sheets! Therefore, verify Debt-to-Equity stays comfortably below 0.5x alongside Interest Coverage above 4x EBIT. Also confirm promoters avoid risky collateral mortgages inside our promoter pledging guide.
Filter Six — Positive Free Cash Flow Conversion
Reported paper profit bends easily under creative accounting, whereas bank cash tells the honest story! Insist that cumulative Operating Cash Flow tracks Net Profit closely rather than stalling in receivables. Then estimate intrinsic cash value conservatively inside our DCF valuation calculator.
Filter Seven — Insider Buying and Buyback Signals
Finally, watch quiet insider purchases near multi-month consolidation bases on NSE corporate filings! When promoters deploy personal savings or debt-free firms launch open market buybacks, leadership signals confidence internally.
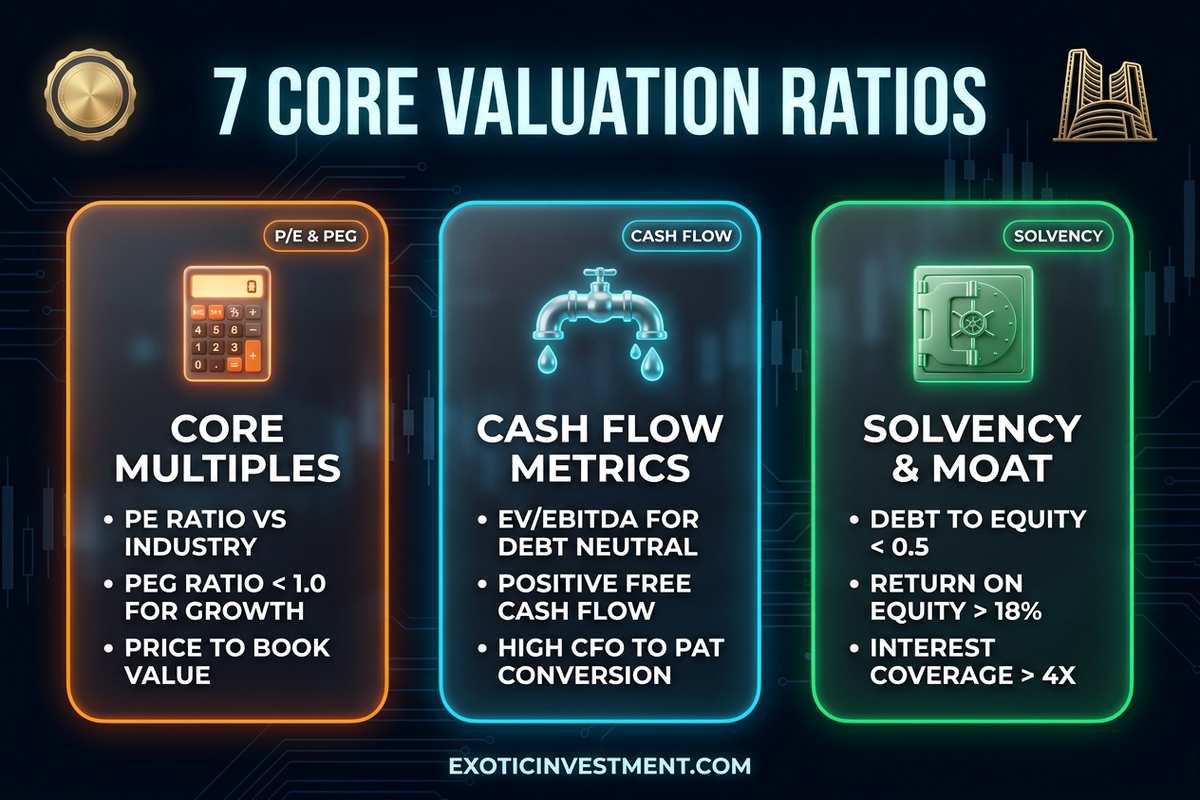
Illustration: Core valuation checklist pairing P/E, PEG < 1.0, EV/EBITDA, positive Free Cash Flow, and clean Debt-to-Equity health.
Institutional Benchmark Table: Healthy Value Signals vs Value Traps
Keep this crisp screening scorecard nearby while auditing quarterly filings across NSE sectors. Running all seven filters takes under ten minutes yet spares portfolios from years of dead money!
| Valuation Metric | Healthy Bargain Range | Best Sectors for Metric | Value Trap Red Flag |
|---|---|---|---|
| P/E vs 5-Yr Median | 15%–30% below median & peers | IT, FMCG, Pharma, Consumer | Low P/E from one-off land sale |
| PEG Ratio | Under 1.0 with steady growth | Expanding Midcaps & Specialty | Unrealistic 50% EPS forecasts |
| P/B + ROE Pairing | P/B < 2x paired with ROE > 15% | Banks, NBFCs, PSU Lenders | Low P/B alongside rising NPAs |
| EV / EBITDA | Noticeably below industry median | Metals, Cement, Auto, Telecom | Commodity peak cycle earnings |
| Debt / Equity Ratio | < 0.5x (zero pledge risk) | All Non-Financial Sectors | Rising debt hiding weak margins |
| Free Cash Flow (FCF) | Consistent positive cash surplus | Every Cash-Generative Business | Negative CFO despite high PAT |
Worked Intrinsic Value Example: Avoiding a Classic Value Trap
Let us compare two hypothetical ₹400 stocks side by side to practice how to spot undervalued stocks safely! Company X trades at ₹400 on ₹50 EPS (8x P/E), yet sales dropped 12% yearly with Debt-to-Equity above 2.1x. Meanwhile, Company Y trades at ₹400 on ₹25 EPS (16x P/E), zero bank loans, 22% ROE, and steady 20% growth giving a crisp 0.80 PEG!
Clearly, Company X’s shrinking cash base signals a dangerous trap despite its low P/E tag. By contrast, Company Y blends growth strength with safety—test fair value cleanly inside our DCF stock calculator and P/E vs PEG guide today.

Illustration: Spotting genuine bargain compounders (low PEG, high ROE, clean CFO) versus shrinking high-debt value traps.
Pairing Fundamental Value With Technical Base Confirmation
Remember a classic Dalal Street lesson: cheap stocks frequently slide lower for months while weak hands sell out! Smart investors therefore avoid buying plunging knives blindly during steep downtrends. Instead, confirm fundamental worth first, then wait calmly for weekly base breakouts using our technical indicator checklist and live EMA crossover screener.
Step-by-Step Margin of Safety Checklist Before Accumulating
Mastering how to spot undervalued stocks starts with disciplined skepticism toward rosy corporate forecasts! First, discount future revenue estimates by at least 20% to guard against surprise slowdowns. Next, confirm whether management treats minority owners fairly through steady cash dividends or timely share buybacks.
In addition, inspect quarterly working capital days across inventories and trade receivables carefully! Whenever revenue spikes alongside bloating unpaid bills, real cash generation is stalling quietly beneath headline profits. Check clean sector earnings trends and institutional buying flows via our FII DII data tracker and momentum stock screener first.
Finally, split long-term accumulation entries across three calm monthly tranches instead of exhausting cash on day one! Therefore, genuine bargain stocks compound reliably once temporary sector gloom clears out.
🚀 Trade Clean Dalal Street Setups With Institutional Discipline
Stop falling for cheap-looking value traps. Spot genuine compounders and time clean entries alongside Dr. Ashok Kumar N Rao and our 1,300+ active trading community.
- Master fundamental valuation with our Kaliyiri Share Market Book and English bestseller Basics of Indian Stock Market Book.
- Access institutional screeners and pro research via the MultiBagger Plus Courses & Pro Tools Annual Subscription.
- Time value entries cleanly in our Technical Analysis Course in Kannada or index setups in our Options Buying Course in Kannada.
💡 Frequently Asked Questions (FAQ): How to Spot Undervalued Stocks
1. What is the quickest rule for how to spot undervalued stocks?
Look for profitable businesses priced below five-year median P/E and sector averages alongside low debt and ROE above 15%. Run instant peer comparisons via our relative valuation calculator cleanly.
2. Is every low P/E stock automatically undervalued?
No — cyclical businesses at peak margins frequently print deceptive 6x P/E tags right before profits drop! Check operating margin sustainability carefully inside our operating margin guide first.
3. What is considered a good PEG ratio for Indian growth stocks?
Generally, a PEG score under 1.0 signals fair growth-adjusted pricing, whereas figures above 2.0 look expensive! Compute exact growth multiples cleanly inside our PEG ratio calculator today.
4. Why must value investors inspect Free Cash Flow alongside Net Profit?
Reported net profit includes non-cash adjustments, whereas Free Cash Flow verifies real rupees remain after factory spending! Estimate intrinsic cash targets using our DCF valuation tool cleanly.
5. Which valuation ratio works best for Indian bank and NBFC stocks?
For banks and lenders, Price-to-Book paired with asset quality and Return on Assets offers sharper insight than EV/EBITDA! Compare sector peers quickly inside our valuation comparison tool cleanly.
6. Should I buy an undervalued stock while its price is still crashing steeply?
Wait — even genuinely cheap stocks routinely overshoot downward during panic selling waves! Let charts base cleanly and obey strict position sizing limits on entry.