
Listen, boss, picking reliable stock market indicators turns noisy Dalal Street price swings into clear execution signals. Most beginners lose capital quickly because they load twelve flashing lines onto one chart. Today, however, our leading stock market indicators guide and institutional desk checklist simplify chart reading completely.
Here is the honest truth from watching thousands of retail Nifty and Bank Nifty charts. Price action always stays king because candlesticks reflect real institutional cash flow. Therefore, technical tools work best as confirmation filters rather than crystal-ball predictions.
Let us keep today’s breakdown practical, structured, and focused purely on Indian equities. First, you will learn how trend, momentum, volatility, and volume tools divide cleanly into distinct roles. In addition, we share exact parameter settings, worked ₹2,50,000 sizing math, and costly indicator traps.
What Are Stock Market Indicators and How Do They Work on NSE?
Simply put, technical tools apply mathematical formulas directly to historical open, high, low, close, and traded volume data. Because SEBI mandates transparent tick reporting, NSE and BSE charts feed accurate numbers every second. Consequently, millions of Indian traders track the same key levels simultaneously.
Specifically, chart tools fall into two practical families across institutional desks. Leading tools try to spot exhaustion or strength just before major reversals unfold. In contrast, lagging tools wait for a confirmed price trend before signaling clean entry momentum.
Naturally, relying exclusively on lagging tools makes your entry late during sharp weekly breakouts. On the other hand, trusting a single oversold oscillator inside a crashing bear sector invites catching falling knives. Always map baseline support and resistance zones first before reading any indicator panel.
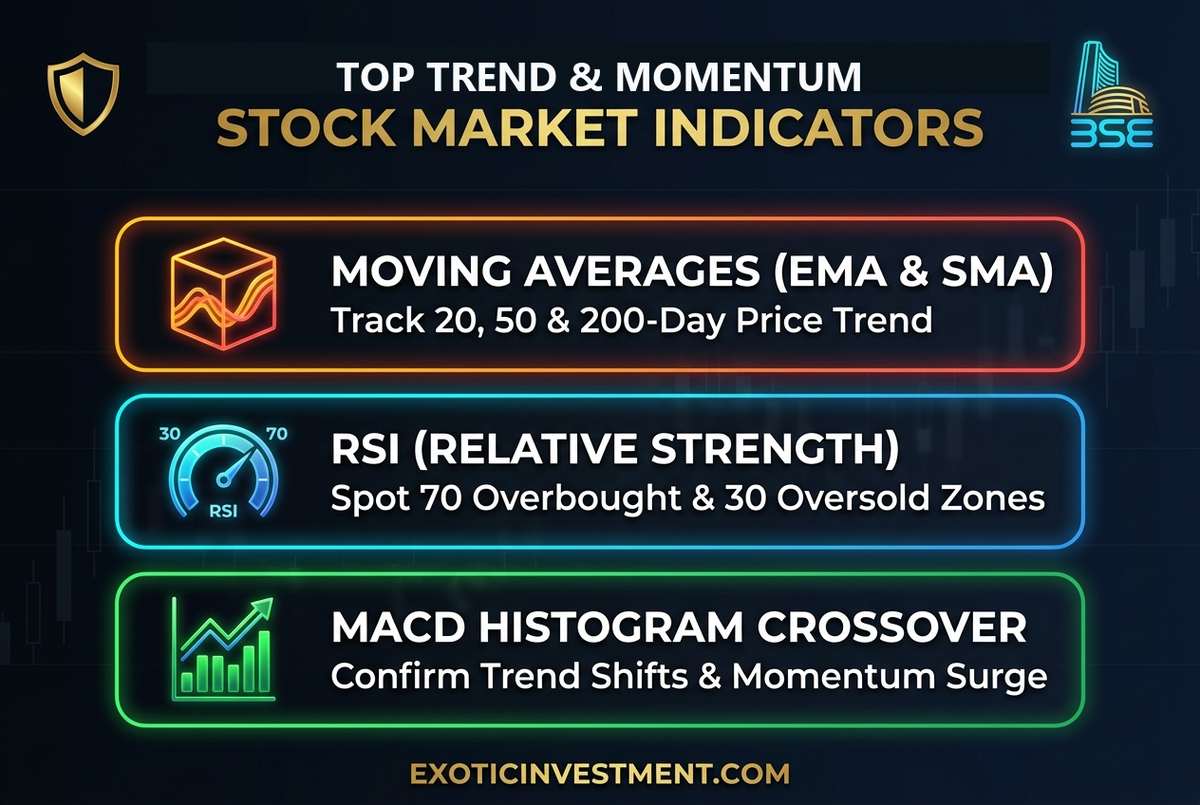
Illustration: Moving averages, RSI, and MACD crossover metrics forming core trend and momentum signals.
Core Trend and Momentum Stock Market Indicators Every Indian Trader Needs
Every clean trading setup answers two non-negotiable questions before risking one rupee. First, which direction controls the higher weekly and daily trend today? Second, does buying momentum support fresh upside or signal quiet exhaustion?
Exponential Moving Averages (20 EMA, 50 EMA, 200 SMA)
Moving averages smooth choppy intraday noise into a clean visual trend curve. Specifically, Indian swing desks weight recent candles heavier through the 20-day and 50-day Exponential Moving Averages (EMA). Meanwhile, institutional wealth funds track the 200-day Simple Moving Average (SMA) as long-term market health.
For example, when a Nifty 50 constituent pulls back gently to its rising 20 EMA on falling volume, institutions often accumulate quietly. Look closely at how Golden Cross patterns form in our moving averages trend guide too. You can also scan live setups fast using our live EMA crossover screener after market close.
Relative Strength Index (14-Period RSI)
Created by analyst Welles Wilder, RSI measures buying speed versus selling pressure inside a zero-to-hundred scale. Traditionally, textbooks mark readings above 70 as overbought and values below 30 as oversold. However, powerful Indian bull leaders frequently stay between 55 and 85 for months during earnings cycles.
Therefore, seasoned traders treat the 40 and 60 levels as regime markers rather than blind reversal switches. Check out deeper divergence examples inside our RSI relative strength guide to avoid early shorts. When price makes a higher high while RSI prints a lower peak, hidden momentum fades fast.
Moving Average Convergence Divergence (MACD 12, 26, 9)
MACD blends trend direction and momentum speed neatly inside one lower chart window. Specifically, it compares a fast 12-period EMA against a slow 26-period EMA alongside a 9-period signal trigger. As a result, expanding green histogram bars confirm rising institutional conviction cleanly.
Meanwhile, watch zero-line crossovers carefully rather than taking every small signal cross in sideways weeks. When both lines climb above zero on daily charts, multi-week trend reliability improves noticeably. Pair MACD confirmation neatly with our momentum stock screener during sector rotation phases.
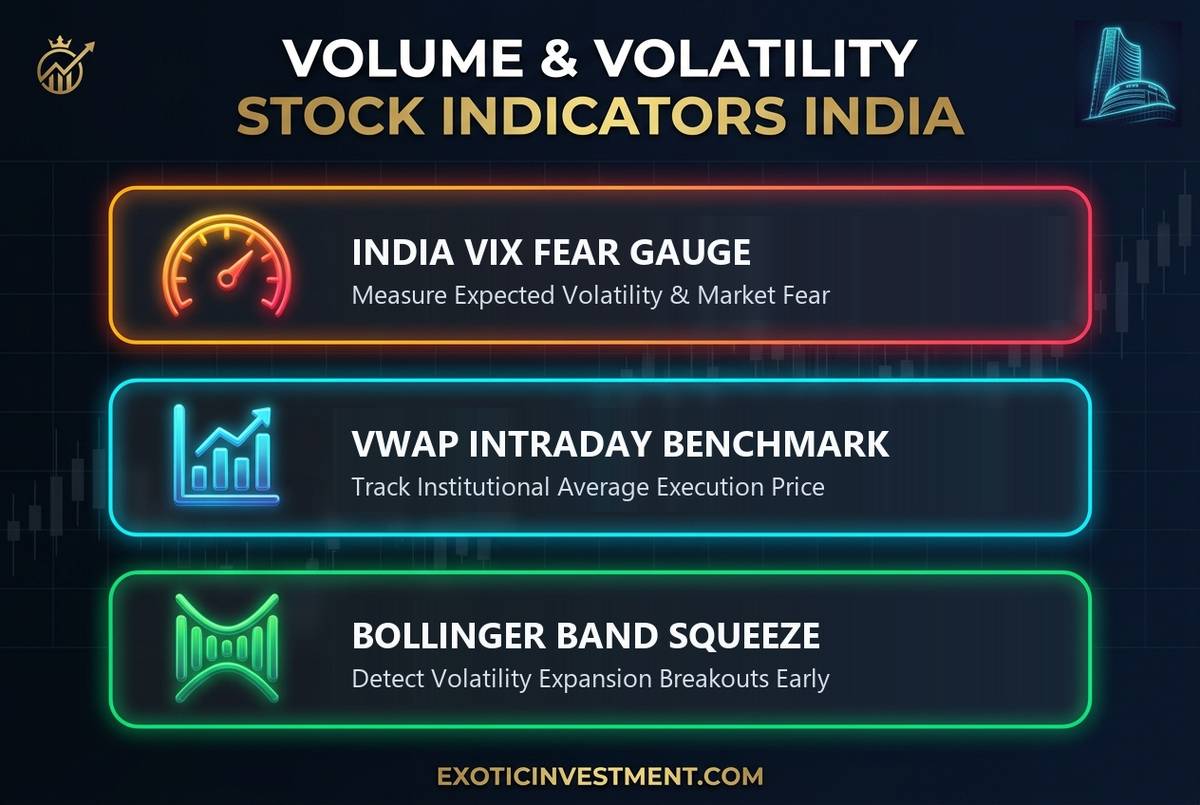
Illustration: India VIX, VWAP benchmark, and Bollinger Band squeeze tracking market volatility and institutional liquidity.
Top Volume and Volatility Indicators Used on Dalal Street
Price moving upward on tiny retail volume rarely survives strong afternoon profit booking. Similarly, misreading sudden volatility spikes destroys carefully planned option and swing positions quickly. Therefore, adding one volume anchor and one volatility filter sharpens trade timing significantly.
Volume Weighted Average Price (VWAP)
VWAP calculates the true average traded price weighted by volume throughout a single market session. Institutional execution desks use VWAP daily between 9:15 AM and 3:30 PM as their fair-value anchor. For example, buyers control intraday order flow whenever Nifty stocks hold cleanly above rising VWAP.
In contrast, failing repeatedly under flat VWAP around mid-session reveals heavy supply overhead. Remember that standard anchored VWAP resets every morning on opening ticks. Always verify opening order imbalances cleanly alongside our open high open low screener before market momentum settles.
India VIX (The Nifty Volatility Gauge)
Published directly by NSE, India VIX measures expected annualized Nifty swings over the upcoming 30 days using live option prices. Typically, readings between 11 and 15 reflect calm bull trending phases across Indian large caps. However, sharp jumps above 20 ahead of Union Budgets or RBI policy dates warn traders to tighten exposure quickly.
High India VIX inflates weekly call and put premiums sharply across index options. Conversely, sudden VIX drops immediately after major news events trigger painful option premium crush. Therefore, match position sizing dynamically using our trading risk management calculator whenever India VIX spikes.
Bollinger Bands (20 SMA, 2 Standard Deviations)
Designed by John Bollinger, these three curved channels hug price dynamically as volatility expands and contracts. When upper and lower bands pinch tightly together around flat price action, a low-volatility squeeze begins. History shows quiet volatility compressions frequently precede explosive multi-day directional breakouts.
Specifically, wait for a high-volume daily candle close cleanly outside the upper or lower band before acting. Remember that band touches alone never justify blind counter-trend trades during runaway news trends. Also cross-check institutional day thresholds using our pivot point calculator and Central Pivot Range levels.
Complete Comparison Matrix of Popular Indian Stock Market Indicators
Choosing the wrong tool for a sideways or trending market causes unnecessary stop-outs. Study the side-by-side institutional reference table below to keep your chart workspace clean and non-redundant.
| Indicator Name | Core Role & Setting | Best Signal Condition | Major Retail Trap |
|---|---|---|---|
| EMA (20, 50, 200) | Trend direction; dynamic support | Pullbacks in established trends | Whipsaws in flat tight ranges |
| RSI (14 Period) | Momentum oscillator (0–100) | Holding 40–60 zones + divergence | Shorting strong stocks at RSI 70 |
| MACD (12, 26, 9) | Trend + histogram momentum | Zero-line cross + rising bars | Late entries in fast spikes |
| VWAP (Session) | Intraday fair value by volume | Institutional dip-buys above line | Using VWAP on multi-month charts |
| Bollinger Bands (20, 2) | Volatility envelope breakout | Band squeeze + volume expansion | Fading strong upper-band walks |
| India VIX & PCR | Market breadth & fear gauge | Macro risk & sizing discipline | Treating VIX alone as timing trigger |
Market Breadth Indicators: Put-Call Ratio, Advance-Decline, and Delivery %
Headline Nifty 50 gains often hide serious weakness underneath broader midcap and smallcap portfolios. When only three heavyweight bank stocks pull Nifty higher while 35 stocks decline, fragile rallies snap quickly. Checking market breadth saves traders from buying weak breakouts right at index peaks.
First, monitor the NSE Advance-Decline Ratio daily across Nifty 500 constituents. Healthy bull rallies consistently print more advancing stocks than declining tickers week after week. Second, combine Nifty Put-Call Ratio (PCR) around 0.8 to 1.3 with relative strength outperformance scans to spot sector leaders early.
Third, inspect NSE daily Delivery Percentage alongside price breakouts in cash-market equities. Rising prices backed by 50%+ delivery volume prove real institutional accumulation rather than intraday gambling. Always cross-verify exchange circuit rules via our circuit limit guide during sharp smallcap volume surges.
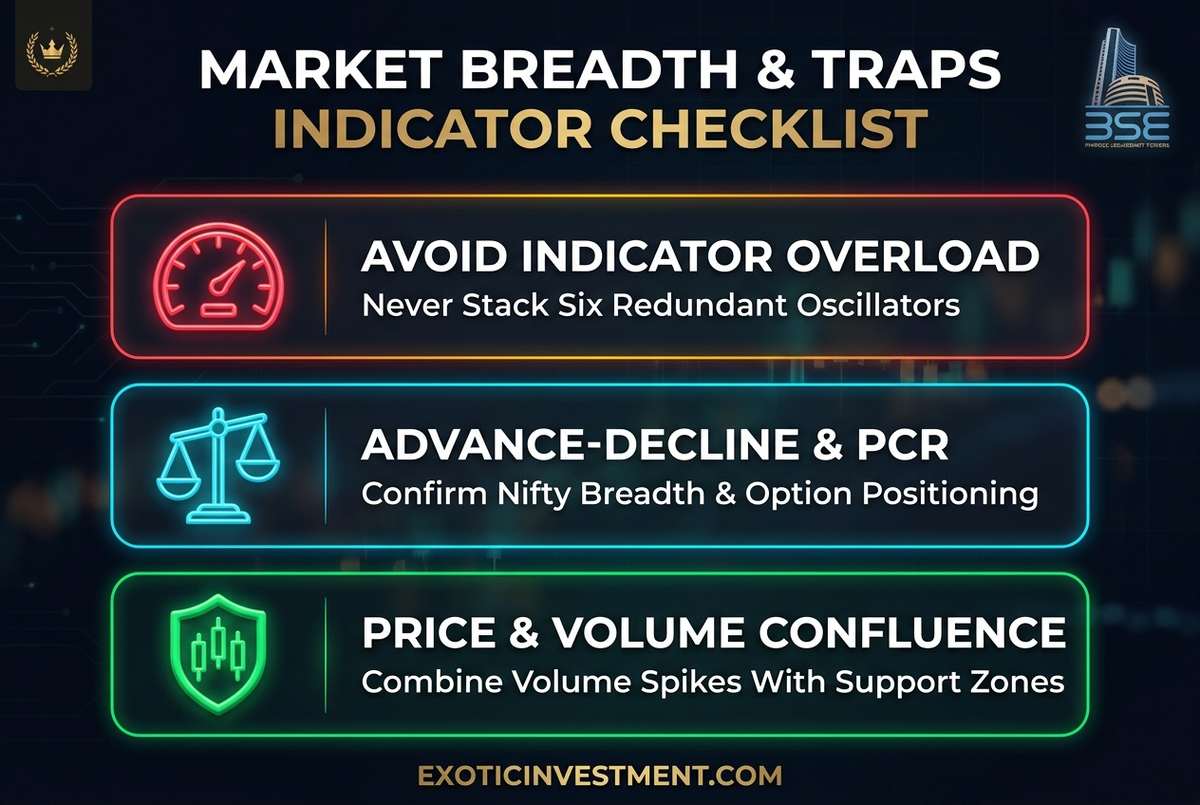
Illustration: Checklist for combining market breadth, Advance-Decline, and price-volume confluence without indicator overload.
Step-by-Step Confluence Method & Worked ₹2,50,000 Trade Example
Using separate indicator families together builds disciplined confluence without cluttering your screen. Let us walk through an educational ₹2,50,000 swing capital calculation on a hypothetical NSE stock trading near ₹500. Notice how every indicator plays one distinct role from scan to stop-loss placement.
Step 1 — Filter Trend & Breadth: First, verify Nifty trades above its rising 50 EMA with healthy Advance-Decline breadth above 1.2. Next, scan cash equities climbing above their 200 SMA on our 52-week high breakout radar to focus only on strong leaders.
Step 2 — Confirm Momentum & Volume Entry: Wait for a tight Bollinger squeeze breakout above ₹500 accompanied by 1.8x average daily volume. Simultaneously, confirm 14-day RSI pushes cleanly above 60 without immediate overbought reversal divergence. Also check last traded and average price mechanics before placing clean limit orders.
Step 3 — Size Position & Protect Downside: Suppose the 20 EMA swing invalidation sits clearly at ₹475, creating ₹25 per share risk. On ₹2,50,000 capital risking strictly 1% (₹2,500), you buy exactly 100 shares (₹50,000 exposure) via our position size calculator. Then attach a protective stop immediately using trailing stop-loss discipline while tracking costs via our brokerage calculator.
Five Costly Indicator Mistakes That Drain Retail Accounts
Even brilliant mathematical tools fail horribly when traders skip basic risk discipline. Eliminate these five frequent mistakes today so your indicator checklist actually protects net capital.
Mistake 1 — Indicator Multicollinearity Overload: Stacking RSI, Stochastic, CCI, and Williams %R together creates false confidence because all four measure identical momentum data. Keep strictly one trend tool, one momentum oscillator, and one volume metric per chart.
Mistake 2 — Ignoring Higher Timeframe Context: Buying a 5-minute MACD crossover directly into heavy daily chart supply fails repeatedly on Dalal Street. Always check daily and weekly candlesticks first before timing lower-timeframe entries.
Mistake 3 — Blind Counter-Trend Oscillator Shorts: Shorting strong multi-quarter leaders simply because daily RSI crosses 70 wipes out capital fast. Wait for clear market-structure breaks alongside divergence before expecting deep corrections.
Mistake 4 — Skipping Exchange Surveillance Checks: Chasing sudden breakout indicators inside restricted microcap tickers locks capital inside lower circuits quickly. Verify surveillance lists via our ASM and GSM framework guide before deploying fresh cash.
Mistake 5 — Chasing Unverified Signals After Big Losses: Tweaking indicator parameters randomly after two losing trades guarantees curve-fitted disappointment. Test net post-tax expectancy carefully using our stock profit calculator over at least fifty clean setups.
🚀 Trade Clean Charts With Institutional Indicator Discipline
Stop guessing chart signals with random settings. Master structured NSE technical execution alongside Dr. Ashok Kumar N Rao and our 1,300+ active trading community.
- Build clear market foundations with our Kaliyiri Share Market Book and our English guide Basics of Indian Stock Market Book.
- Access institutional screeners and pro research via the MultiBagger Plus Courses & Pro Tools Annual Subscription.
- Learn price structure cleanly in our Technical Analysis Course in Kannada or index strategies in our Options Buying Course in Kannada.
💡 Frequently Asked Questions (FAQ): Stock Market Indicators
1. Which stock market indicators work best for beginners in India?
Beginners get clean clarity by pairing the 20 EMA, 14-period RSI, and raw traded volume on daily charts. You can track live trend setups effortlessly using our live EMA crossover screener without crowding your screen.
2. How many technical indicators should I put on one NSE chart?
Limit every chart to two or maximum three non-overlapping tools covering trend, momentum, and volume confirmation cleanly. Read our leading stock indicators guide to eliminate redundant oscillators immediately.
3. Is VWAP useful for long-term delivery investing?
Standard session VWAP resets daily, so institutional desks use it mainly for intraday timing and large execution scaling. Multi-year investors rely instead on weekly moving averages and PE valuation metrics alongside strong earnings growth.
4. What does a rising India VIX tell traders about Nifty options?
Rising India VIX warns that option traders expect wider 30-day Nifty swings and inflated premium pricing ahead. Always scale exposure cautiously inside our risk management calculator when VIX climbs rapidly.
5. Do any indicators guarantee 100% accuracy in stock trading?
No indicator in world finance achieves 100% accuracy because unexpected macro news can reverse any setup instantly. Always pair high-probability setups with strict stop orders from our trailing stop-loss guide to preserve trading capital.
6. What timeframe suits RSI and MACD best for Indian swing trading?
Daily and weekly candlestick timeframes deliver significantly higher signal reliability by filtering noisy 5-minute algorithmic spikes cleanly. Combine daily candle alignment via our day chart candlestick guide with strong sector breadth.