
Support and Resistance Levels Explained: A Beginner’s Guide to Indian Stock Trading (2026)
Welcome to the complete guide on support and resistance levels India. If you want to trade successfully in the Indian stock market, mastering key price levels is essential. If you want to trade successfully in the Indian stock market, mastering key price levels is essential. In fact, price action trading revolves around identifying where buyers and sellers clash on stock charts.
Before diving into chart levels, make sure you understand fundamental analysis. For instance, read our guides on how to get into the Indian stock market, what to look for in stocks to invest, how to read a balance sheet, and P/E ratio valuation metrics. Fundamental analysis tells you what to buy. However, technical analysis tells you when to enter and exit trades.
Furthermore, review our technical analysis series. Specifically, check our intro to technical analysis, moving averages trend guide, and RSI indicator guide.
Understanding support and resistance levels India
Firstly, let us define support. Support is a price level where a falling stock stops declining. In fact, think of support as a visual floor. When price drops to a support zone, buyers enter the market. Consequently, buying demand absorbs selling pressure, and the price bounces upward.
Secondly, let us define resistance. Resistance is a price level where a rising stock stops climbing. Therefore, think of resistance as a visual ceiling. When price climbs to a resistance zone, sellers enter the market. As a result, profit-taking pushes the price downward.
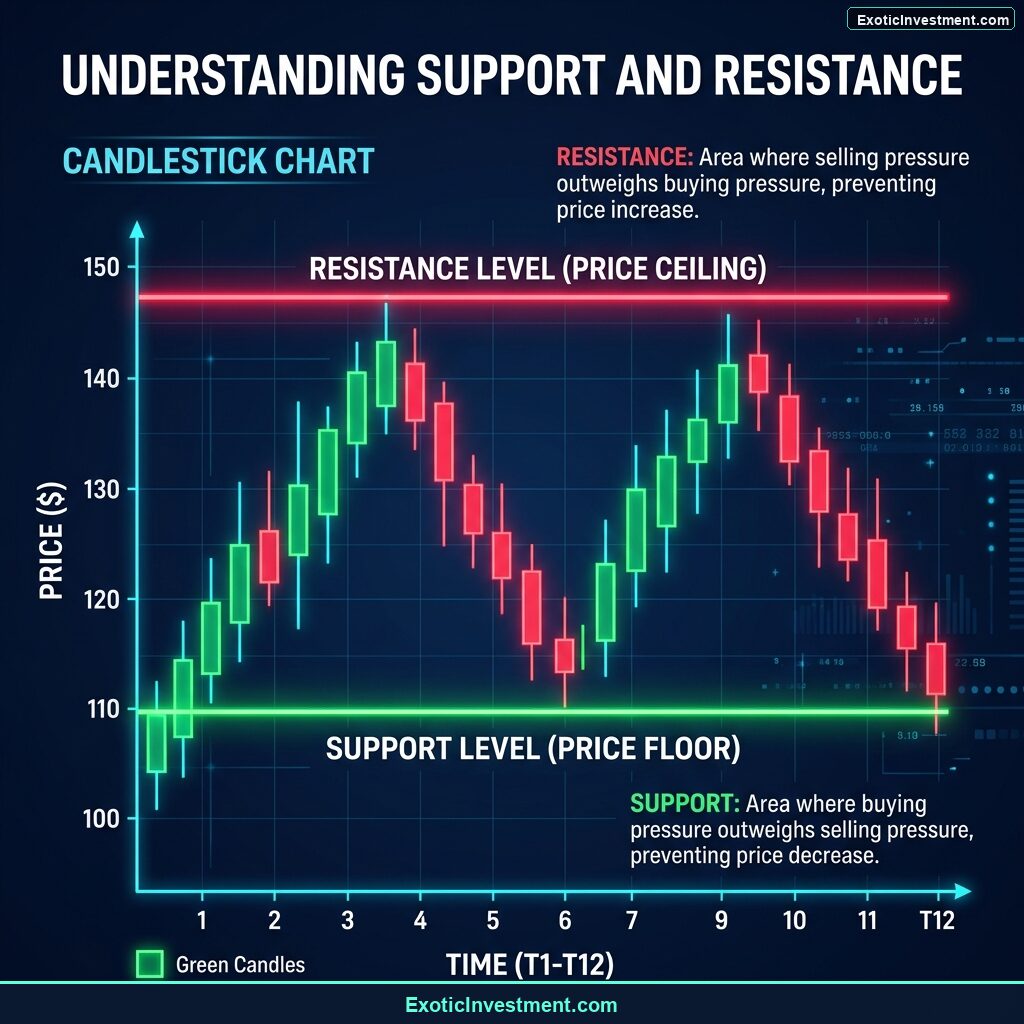
Illustration 1: Support Level (Price Floor) and Resistance Level (Price Ceiling) Concept
Master Technical Analysis & Trading: Recommended Courses & Books
For investors seeking structured learning, we offer dedicated training resources. In addition, these courses provide practical market knowledge:
Recommended Trading Courses & Premium Subscriptions:
- Technical Analysis in Kannada Course: Learn chart reading, support/resistance mapping, and candlestick setups in simple Kannada: Technical Analysis in Kannada Course.
- Kaliyiri Share Market Book: Learn stock market fundamentals and wealth creation in Kannada: Kaliyiri Share Market Book.
- Basics of Stock Market Course: Build your stock market foundation from scratch: Basics of Stock Market Course.
- Options Buying Course in Kannada: Master Nifty and Bank Nifty option buying setups: Options Buying Course in Kannada.
- Multibagger Stocks & Pro Subscription (Product 2739): Access premium stock picks, research reports, and pro trader alerts: MultiBagger Plus Courses & Pro Tools Annual Subscription (Direct checkout: Buy Pro Subscription Product 2739).
Why support and resistance levels India Form
Support and resistance levels exist due to human psychology. Specifically, market memory creates predictable buying and selling zones:
- Previous Highs and Lows: Traders remember previous price turns. For instance, if Nifty bounced at 21,000 previously, buyers anticipate another bounce. Therefore, buying orders stack at that level.
- Psychological Round Numbers: Investors anchor to round numbers. For example, stock prices like ₹500, ₹1,000, or ₹2,000 act as natural barriers. In addition, large option open interest concentrates at round strike prices.
- Dynamic Moving Averages: Moving averages also act as support lines. Specifically, the 50 SMA and 200 SMA provide dynamic floors during strong uptrends.
Role Reversal: When Support Becomes Resistance
In technical analysis, role reversal is a key concept. Once support breaks, it transforms into new resistance. Similarly, when resistance breaks, it transforms into new support.
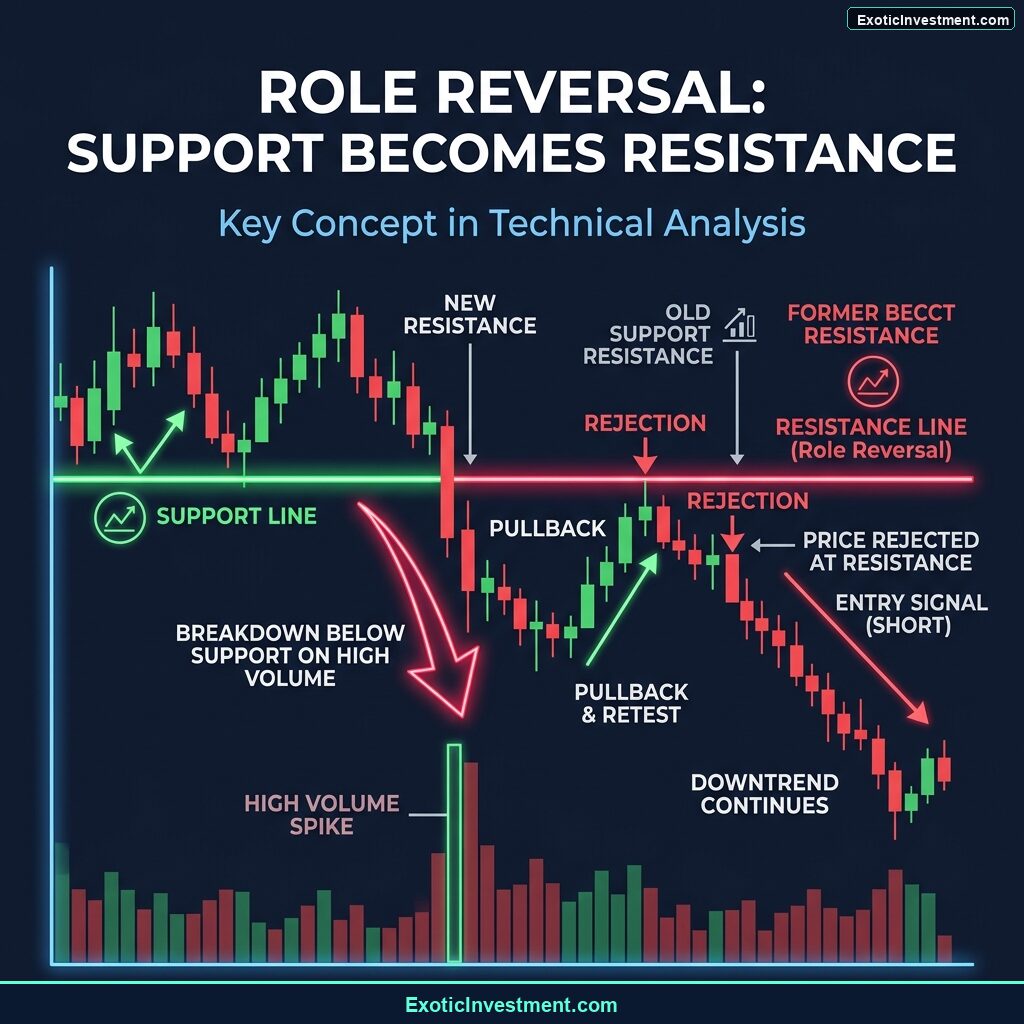
Illustration 2: Role Reversal Diagram (Support Floor Broken Becomes Resistance Ceiling on Retest)
For instance, imagine a stock has strong support at ₹1,000. However, bad news causes price to break below ₹1,000 on high volume. Consequently, traders who bought at ₹1,000 are trapped. When price pulls back to ₹1,000, trapped buyers sell to break even. Therefore, ₹1,000 becomes a new resistance ceiling.
Furthermore, combine role reversal with classic chart patterns. Read our guide on mastering chart patterns in stock trading to spot Double Tops, Double Bottoms, and Head & Shoulders setups.
Automated Pivot Points & Trade Setup Planning
Intraday traders often use mathematical pivot points. In fact, pivot points calculate daily support (S1, S2, S3) and resistance (R1, R2, R3) levels automatically.
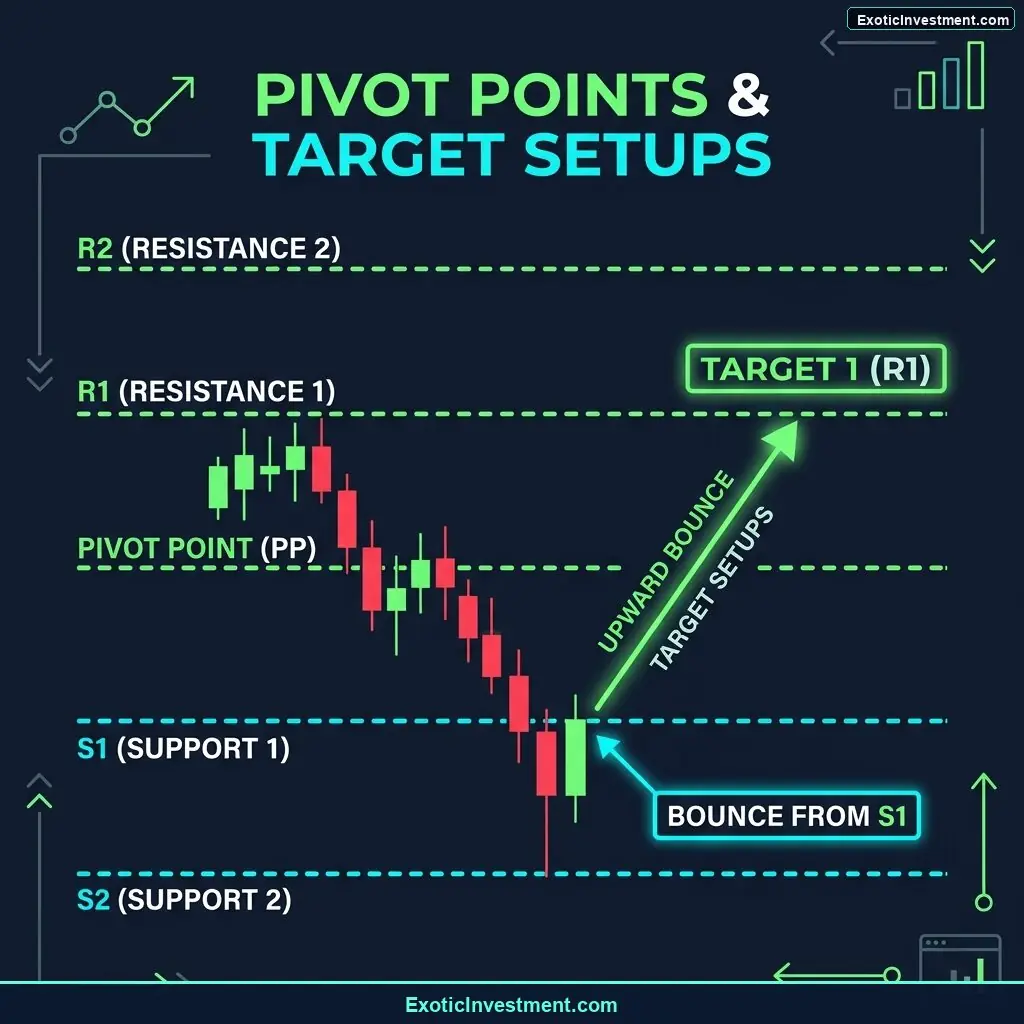
Illustration 3: Intraday Pivot Points Setup (S1 Support Bounce toward R1 Resistance Target)
Use our automated Pivot Point Calculator to generate daily support and resistance levels for Nifty 50 and Bank Nifty in seconds.
Step-by-Step Guide to Drawing support and resistance levels India
To draw accurate levels on your chart, follow this simple workflow:
- Select Higher Timeframes: Firstly, open a daily or weekly chart. Higher timeframes reveal stronger support and resistance zones.
- Identify Multiple Touches: Secondly, look for price levels where candles touched and reversed at least two or three times. More touches mean a stronger level.
- Draw Zones, Not Lines: Thirdly, mark price zones rather than exact single numbers. In fact, support and resistance are price areas.
- Confirm with Trading Volume: Finally, verify volume at key levels. High volume confirms the importance of the support or resistance zone.
Real-World Case Studies: Indian Blue-Chip Stocks
Let us analyze real-world examples from the Indian stock market:
1. Reliance Industries (RIL)
For example, Reliance Industries has historically respected strong horizontal support near major round numbers. When price pulled back to support during market corrections, institutional buyers stepped in. Consequently, price bounced sharply, rewarding patient traders.
2. Tata Consultancy Services (TCS)
Similarly, TCS often consolidates near resistance before quarterly earnings. Once price breaks above resistance with expanding volume, a strong rally follows. However, if earnings disappoint, resistance holds firm and price drops back to support.
Trading Strategies: Buying at Support and Selling at Resistance
Now, let us examine practical trading execution strategies:
Strategy 1: The Support Bounce Trade
Firstly, wait for price to touch an established support zone. However, do not buy immediately. Instead, wait for a bullish reversal candle like a Hammer or Bullish Engulfing. Once the candle closes, enter the trade. Place your stop loss just below support.
Strategy 2: The Resistance Breakdown Trade
Secondly, look for price approaching major resistance. If a bearish Shooting Star forms, sellers are taking over. Consequently, enter a short position or exit long positions. Place your stop loss just above resistance.
Strategy 3: The Breakout Retest Trade
Finally, monitor strong resistance breakouts. When price breaks above resistance with high volume, wait for a pullback retest. As a result, previous resistance acts as new support, offering a low-risk entry point.
Risk Management and Position Sizing
Even strong support levels can fail. Therefore, risk management is essential on every trade:
- Set Stop Losses: Place your stop loss just below support when buying. Use our Stop Loss Calculator to calculate your exact rupee risk.
- Scan Volume Breakouts: Confirm breakouts above resistance using the Intraday Breakout Stock Scanner or Momentum Stock Screener.
- Calculate Charges & Returns: Estimate trade costs with the Zerodha Brokerage Calculator or Upstox Brokerage Calculator. In addition, calculate net profits with our Stock Profit Calculator.
- Passive Wealth Options: If you prefer long-term compounding over active trading, explore why stock market investment is better than other investments. Calculate monthly compounding with the Groww SIP Calculator or build passive cash flow with dividend investing in India.
If you hold digital assets alongside traditional stocks, track your overall net worth. For instance, use a crypto portfolio tracker from Emintage. In addition, calculate tax obligations with a crypto tax calculator or project returns with a bitcoin profit calculator.
How to Avoid False Breakouts at Key Resistance Levels
Firstly, false breakouts are common in volatile markets. In fact, price often spikes above resistance briefly to trap retail buyers. However, institutional sellers quickly push price back down. Consequently, chasing immediate breakouts without confirmation leads to severe losses.
Therefore, follow these rules to avoid false breakout traps:
- Wait for Candle Closure: Never buy during an active candle. Instead, wait for the candle to close above resistance on your timeframe.
- Confirm Volume Surge: In addition, verify trading volume. True breakouts require strong volume expansion. Otherwise, low volume indicates a weak move.
- Look for Re-test Confirmation: Finally, wait for a pullback. When price re-tests previous resistance as support, enter the trade safely.
Combining Support & Resistance with Market Indicators
Furthermore, never trade support and resistance in isolation. Specifically, combine horizontal levels with momentum indicators:
- RSI Divergence at Support: For example, if price touches support while RSI shows bullish divergence, a strong reversal is likely. Learn more in our RSI indicator guide.
- Moving Average Confluence: Similarly, when the 50 SMA aligns with a key support floor, the level becomes far stronger. Learn more in our moving averages guide.
- Classical Reversal Patterns: In addition, spot Double Bottoms or Morning Stars at support. Learn more in our chart patterns guide.
Frequently Asked Questions
Q: Are support and resistance levels 100% accurate?
A: No technical tool is 100% guaranteed. Support and resistance represent high-probability price zones. Therefore, always use stop loss orders.
Q: How many support/resistance levels should I draw on a chart?
A: Focus on the 2 to 3 most prominent levels near the current price. Drawing too many lines creates chart clutter and confusion.
Q: Where can I learn structured technical analysis in Kannada?
A: Enroll in our Technical Analysis in Kannada Course or read our bestselling Kaliyiri Share Market Book.

Trackbacks/Pingbacks