Intro to Technical Analysis: Charts, Candles & Trends for Indian Investors (2026)
Welcome to the comprehensive guide on technical analysis for the Indian stock market. Whether you trade on the National Stock Exchange (NSE) or Bombay Stock Exchange (BSE), mastering technical analysis is the single most effective way to identify high-probability entry and exit points, spot market trends, and protect your hard-earned capital.
If you have already explored our foundational guides on how to get into the Indian stock market, what to look for in stocks to invest, how to read a balance sheet, and P/E ratio valuation metrics, you know that fundamental analysis tells you what company to buy. Technical analysis tells you when to buy and when to sell.
What Is Technical Analysis and Why Does It Work?
Technical analysis is the study of historical price action, chart patterns, and trading volume to forecast future price movements. Unlike fundamental analysis, which focuses on revenue, profit margins, and management quality, technical analysis focuses entirely on market psychology and supply/demand dynamics.
The fundamental premise of technical analysis rests on three core principles:
- Market Action Discounts Everything: All known public information, economic news, quarterly earnings, and investor sentiment are already reflected in the current stock price.
- Prices Move in Trends: Stock prices do not move randomly; they move in identifiable upward, downward, or sideways trends. Once a trend is established, it is more likely to continue than to reverse.
- History Repeats Itself: Human psychology (fear and greed) has remained unchanged for centuries. Because market participants react similarly to support, resistance, and market stress, recurring price patterns appear on stock charts.
Master Technical Analysis in Regional Language & Professional Training Courses
For investors and traders looking to gain deep, structured knowledge in technical analysis, options trading, and wealth creation, we offer dedicated courses and books tailored for your learning journey:
Recommended Trading Courses & Premium Subscriptions:
- Technical Analysis in Kannada Course: If you prefer learning in Kannada, our comprehensive course covers chart reading, candlestick setups, and market strategies in step-by-step detail. Gain deep technical knowledge here: Technical Analysis in Kannada Course.
- Kaliyiri Share Market Book: Learn stock market fundamentals and wealth creation strategies in simple Kannada with our bestselling book: Kaliyiri Share Market Book.
- Basics of Stock Market Course: Master stock market fundamentals from scratch with our popular beginner training: Basics of Stock Market Course.
- Options Buying Course in Kannada: Designed specifically for traders looking to master Nifty and Bank Nifty option buying strategies: Options Buying Course in Kannada.
- Multibagger Stocks & Pro Subscription (Product 2739): Access exclusive multibagger stock recommendations, detailed research reports, and pro trader alerts with our premium subscription: MultiBagger Plus Courses & Pro Tools Annual Subscription (Direct checkout: Buy Pro Subscription Product 2739).
Understanding Candlestick Charts: The Language of Price Action
To read stock charts effectively, you must understand how prices are visually plotted. While line charts show only closing prices, Japanese Candlestick Charts provide a complete 4-dimensional picture of price action within any given period (1 minute, 15 minutes, 1 day, or 1 week).
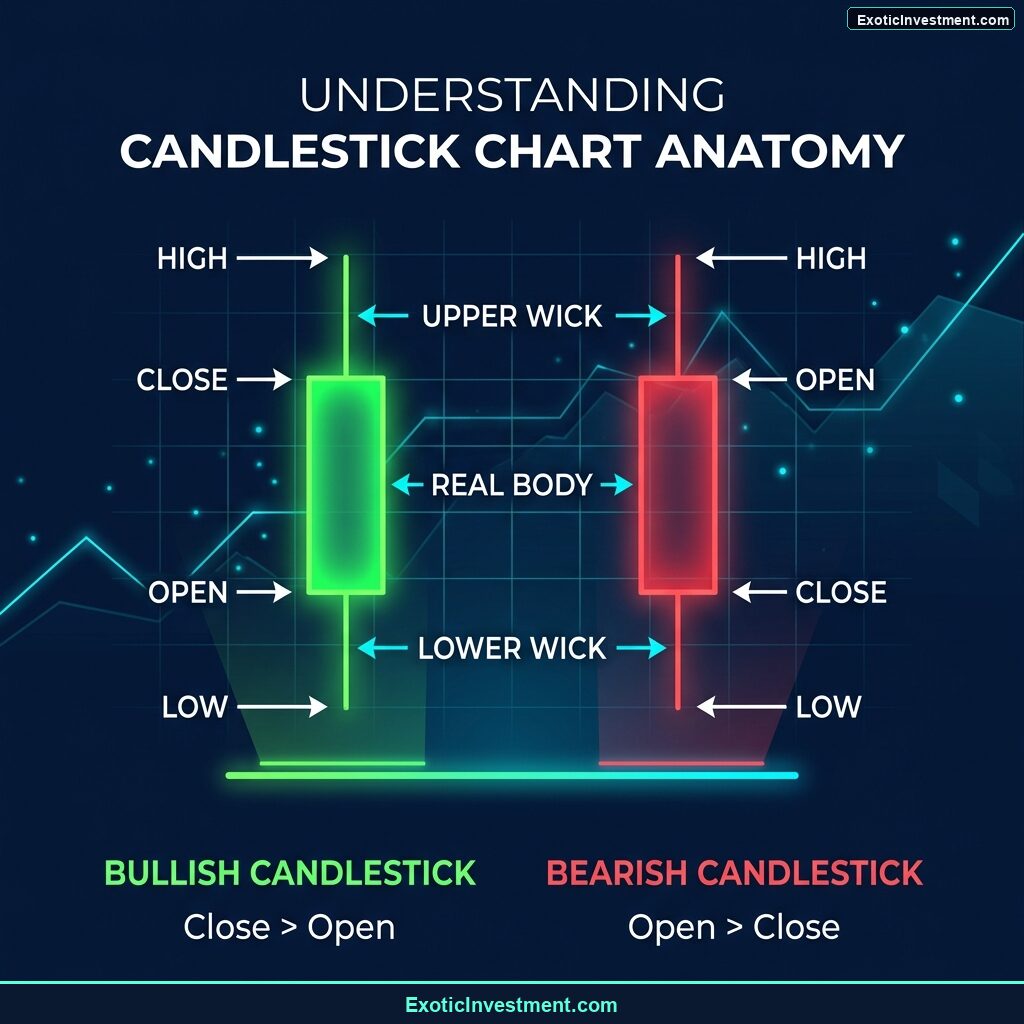
Illustration 1: Candlestick Chart Anatomy (Open, High, Low, Close, Real Body, Wicks)
Every single candlestick displays four essential data points:
- Open (O): The price at which the stock started trading during the period.
- High (H): The highest price reached during the period.
- Low (L): The lowest price reached during the period.
- Close (C): The price at which the stock finished trading during the period.
The Structure of a Candlestick:
A candlestick consists of a central body and thin lines extending from the top and bottom called wicks (or shadows):
- Green (Bullish) Candle: Indicates the close price was higher than the open price (buyers were in control).
- Red (Bearish) Candle: Indicates the close price was lower than the open price (sellers were in control).
- Upper Wick: Represents the highest price buyers attempted to push, but were met with selling pressure.
- Lower Wick: Represents the lowest price sellers pushed down, but were met with buying support.
Core Candlestick Patterns Reference
Once you understand candlestick construction, you can spot high-probability reversal and continuation signals.
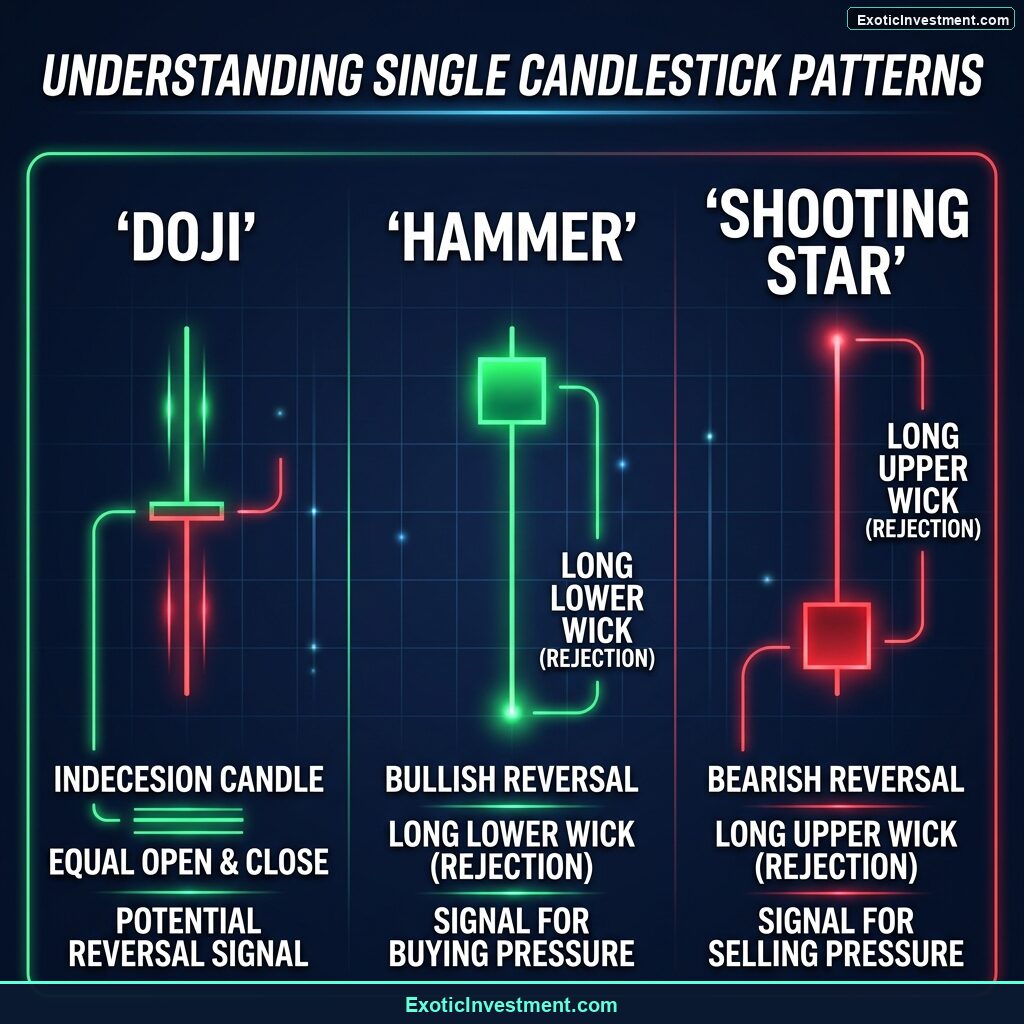
Illustration 2: Single Candlestick Patterns (Doji, Hammer, Shooting Star)
| Pattern | Type | Meaning & Trading Significance |
|---|---|---|
| Doji | Neutral / Reversal | Open and close prices are nearly identical, showing indecision between buyers and sellers. Often signals a potential trend reversal when appearing at key support or resistance. |
| Hammer | Bullish Reversal | Features a small body at the top and a long lower wick (at least twice the length of the body). Shows sellers pushed price down, but strong buyers stepped in to push price back up near the open. |
| Shooting Star | Bearish Reversal | Features a small body at the bottom and a long upper wick. Indicates buyers tried to rally price, but aggressive selling pressure pushed it back down before the close. |
| Bullish Engulfing | Bullish Reversal | A large green candle whose body completely covers (engulfs) the body of the preceding smaller red candle. Indicates buyers have taken decisive control. |
| Bearish Engulfing | Bearish Reversal | A large red candle whose body completely engulfs the preceding green candle. Indicates bears have overwhelmed buyers. |
| Morning Star | Bullish Reversal | A 3-candle pattern: a long red candle, a small indecision candle (or Doji), followed by a strong green candle closing deep into the first candle’s body. Signals a bottom reversal. |
| Evening Star | Bearish Reversal | A 3-candle pattern: a long green candle, a small indecision candle at the top, followed by a strong red candle closing deep into the first candle’s body. Signals a top reversal. |
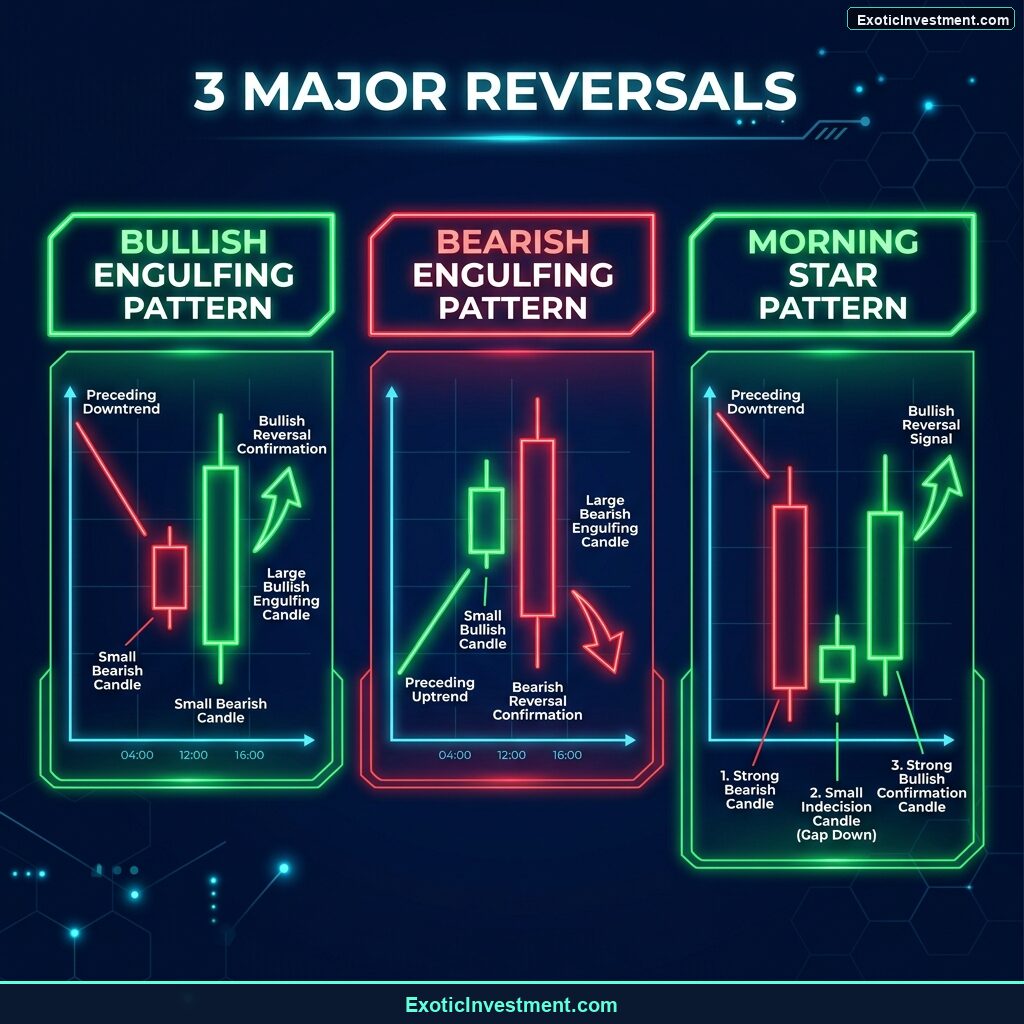
Illustration 3: Reversal Candlestick Formations (Bullish & Bearish Engulfing, Morning Star)
Traders can analyze these candlestick patterns across popular charting tools like Zerodha Kite or Upstox Pro to spot high-probability setups in Indian equities and indices.
Trend Lines and Moving Averages: Riding the Market Wave
Candlestick patterns give immediate entry signals, but technical indicators help confirm the overarching trend direction. Two of the most essential trend-following tools are:
1. Moving Averages
Moving averages smooth out daily price fluctuations to show the true direction of the market. We cover moving average strategies in depth in our dedicated guide on using moving averages for trend confirmation.
- 50 SMA (Simple Moving Average): Used for medium-term trend identification.
- 200 SMA: The ultimate long-term bull/bear benchmark line followed by institutional funds.
2. Relative Strength Index (RSI)
RSI is a momentum oscillator measuring whether a stock is overbought (>70) or oversold (<30). Learn how to spot RSI momentum divergence in our guide on understanding the RSI indicator.
Key Technical Levels: Support & Resistance
Price levels where a stock repeatedly bounces or halts are known as support and resistance. Combining candlestick patterns with key horizontal levels is the cornerstone of professional trading. Read our full guide on support and resistance levels in stock trading and use our automated Pivot Point Calculator for intraday setups.
For chart pattern specialists, explore our breakdown of Double Tops, Double Bottoms, and Head & Shoulders in mastering chart patterns in stock trading.
Risk Management: Protecting Your Capital
No technical pattern or indicator guarantees a 100% win rate. Professional traders succeed because they manage risk rigorously on every single trade:
- Set Stop Losses: Use our Stop Loss Calculator to define your exact rupee risk per share before placing any trade.
- Scan Volume Breakouts: Verify price breakouts with high trading volume using the Intraday Breakout Stock Scanner or Momentum Stock Screener.
- Calculate Charges & Net Profits: Calculate trade costs with the Zerodha Brokerage Calculator or Upstox Brokerage Calculator, and calculate net returns with the Stock Profit Calculator.
- Passive Wealth Alternatives: If you prefer long-term compounding over daily trading, explore why stock market investment is better than other investments, calculate monthly compounding using the Groww SIP Calculator, or build passive cash flow with dividend investing in India.
If you maintain a multi-asset portfolio holding digital assets alongside traditional stocks, track your global positions using a crypto portfolio tracker from Emintage, estimate capital gains tax with a crypto tax calculator, or calculate profit projections with a bitcoin profit calculator.
Frequently Asked Questions
Q: What is the difference between fundamental analysis and technical analysis?
A: Fundamental analysis evaluates business performance (revenue, balance sheet, P/E ratio) to find intrinsic value. Technical analysis evaluates price action, volume, and chart patterns to determine ideal entry and exit timing.
Q: Can beginners trade using candlestick patterns?
A: Yes. Beginners should start by studying simple patterns like Doji and Hammer on daily charts before advancing to complex multi-candle setups.
Q: Where can I get structured technical analysis training in Kannada?
A: You can enroll in our dedicated Technical Analysis in Kannada Course or read our bestselling Kaliyiri Share Market Book.

Trackbacks/Pingbacks