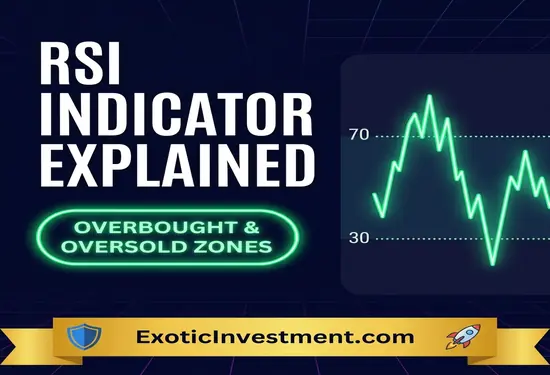
What is RSI (Relative Strength Index) and How to Use It
Whether you are analyzing blue-chip stocks on the NSE, trading Nifty options, or building a swing trading strategy, one technical indicator appears on almost every professional trader’s dashboard: the Relative Strength Index (RSI).
Developed by J. Welles Wilder in 1978, RSI is a momentum oscillator that measures the speed and change of price movements. Unlike trend-following indicators like moving averages (which lag behind current price action), RSI helps traders identify overbought and oversold conditions, spot momentum divergence, and predict potential price trend reversals before they happen.
If you are following our technical analysis roadmap, be sure to review our earlier lessons on how to get into the Indian stock market, intro to technical analysis, and using moving averages for trend confirmation.
How RSI Works (The Core Formula & Scale)
RSI is displayed as a single line graph below the main price chart, oscillating on a scale from 0 to 100. The standard lookback setting for RSI is 14 periods (14 days on a daily chart, 14 candles on an intraday chart).
RSI Calculation Concept: RSI compares the average gains of up days against the average losses of down days over the 14-period window.
When buyers dominate and price advances consistently, RSI rises toward 100. When sellers dominate and price declines, RSI drops toward 0.
Understanding Overbought and Oversold Zones
The traditional interpretation of RSI relies on two key benchmark levels: 70 and 30.
| RSI Value Range | Market Condition | Trading Interpretation |
|---|---|---|
| RSI > 70 | Overbought Zone | Price has risen too fast; momentum is stretched. High risk of profit-taking or reversal. Avoid buying fresh positions. |
| RSI < 30 | Oversold Zone | Price has fallen too fast; heavy panic selling. High probability of a relief bounce or bottom reversal. Look for buy signals. |
| RSI 40 – 60 | Neutral / Equilibrium | Market is consolidating or in a choppy phase. Trend-following indicators should take priority. |
Pro Tip for Indian Trending Markets: During a strong bull market, RSI can remain overbought (>70) for weeks while price continues rising. Never short a strong stock solely because RSI is overbought. Instead, look for confirmation setups like chart pattern breakdowns or moving average crosses.
Advanced RSI Trading Strategies
1. RSI Divergence (The Ultimate Reversal Signal)
RSI divergence occurs when the price movement of a stock moves in the opposite direction of the RSI indicator line. Divergence indicates that the underlying trend momentum is weakening, signaling an impending reversal.
- Bullish Divergence: Price makes a lower low, but RSI makes a higher low. This indicates selling pressure is exhausting, and a bullish reversal is near.
- Bearish Divergence: Price makes a higher high, but RSI makes a lower high. This warns that buying power is weakening, signaling an impending bearish correction.
2. RSI 50-Line Crossover Strategy
The 50 centerline acts as the momentum threshold:
- When RSI crosses above 50, bullish momentum is in control.
- When RSI drops below 50, bearish momentum takes over.
Combining RSI with Fundamental & Technical Tools
To maximize trading win rates, combine RSI signals with multiple technical and fundamental filters:
- Support & Resistance: An oversold RSI (<30) occurring precisely at a key support zone creates a ultra-high-probability buy setup. Learn how to map key levels in our guide on support and resistance levels.
- Reversal Chart Patterns: Combine bullish divergence with Double Bottoms or Head & Shoulders reversals. Learn pattern setups in our guide on mastering chart patterns in stock trading.
- Fundamental Quality: Screen companies with stable earnings by studying what to look for in stocks to invest, reading balance sheets, and evaluating fair P/E ratios.
Risk Management and Position Sizing
Even strong RSI divergence signals can fail during news-driven events or earnings releases. Always practice strict risk control on every trade:
- Define your exact stop loss using our Stop Loss Calculator before entering a trade.
- Identify real-time volume breakout candidates using the Intraday Breakout Stock Scanner or filter high-momentum stocks with our Momentum Stock Screener.
- Factor in trading fees using the Zerodha Brokerage Calculator or Upstox Brokerage Calculator.
- Calculate net profit targets with our Stock Profit Calculator.
For investors focused on long-term compound wealth building rather than short-term trading, check out why stock market investment is better than other investments, calculate monthly systematic returns with the Groww SIP Calculator, or build passive cash flow with dividend investing in India.
If you maintain a multi-asset portfolio including cryptocurrencies alongside equities, monitor your total allocations using a crypto portfolio tracker from Emintage, assess tax obligations with a crypto tax calculator, or calculate profit projections with a bitcoin profit calculator.
Frequently Asked Questions
Q: What is the best RSI setting for swing trading?
A: The default 14-period setting recommended by Wilder works best across daily charts for swing trading in NSE/BSE stocks.
Q: Can RSI be used for intraday trading in Nifty & Bank Nifty?
A: Yes. Intraday traders use 14 RSI on 5-minute charts alongside intraday support/resistance levels generated by our Pivot Point Calculator.
Q: What is the difference between RSI and MACD?
A: RSI is a momentum oscillator measuring price speed and overbought/oversold levels. MACD is a trend-following momentum indicator measuring the relationship between two exponential moving averages.

Trackbacks/Pingbacks