The Basics of Volume and Price Action in Trading
Welcome to our comprehensive guide on volume and price action in trading. If you want to trade successfully in the Indian stock market, combining price action with volume analysis is essential. In fact, volume is the fuel that drives price movements across the National Stock Exchange (NSE) and Bombay Stock Exchange (BSE).
If you are new to market trading, start by reading our foundational step-by-step guide on how to get into the Indian stock market. Fundamental analysis helps you select great companies. However, technical analysis tells you when to enter and exit trades.
Understanding Volume and Price Action in Trading
Firstly, let us define volume. Volume represents the total number of shares traded in a stock or index during a given timeframe. In fact, volume reveals institutional conviction. When large mutual funds or foreign portfolio investors (FPIs) buy a stock, trading volume surges dramatically.
Secondly, let us define price action. Price action is the raw movement of a stock plotted on a chart over time. If you want a refresher on reading price charts, check out our intro to technical analysis guide. Therefore, combining volume and price action provides a complete picture of market supply and demand.
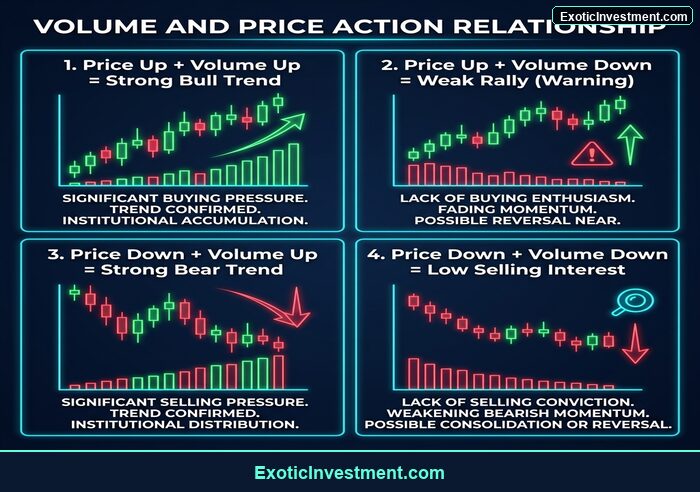
Illustration 1: Four Key Relationships between Volume and Price Action
Master Technical Analysis & Trading: Recommended Courses & Books
For investors seeking structured technical analysis education, we offer dedicated training resources. In addition, these courses provide practical market mastery:
Recommended Trading Courses & Premium Subscriptions:
- Technical Analysis in Kannada Course: Learn chart reading, volume analysis, and candlestick setups in simple Kannada: Technical Analysis in Kannada Course.
- Kaliyiri Share Market Book: Learn stock market fundamentals and wealth creation in simple Kannada: Kaliyiri Share Market Book.
- Basics of Stock Market Course: Build your stock market foundation from scratch: Basics of Stock Market Course.
- Options Buying Course in Kannada: Master Nifty and Bank Nifty option buying setups: Options Buying Course in Kannada.
- Multibagger Stocks & Pro Subscription (Product 2739): Access premium stock picks, research reports, and pro trader alerts: MultiBagger Plus Courses & Pro Tools Annual Subscription (Direct checkout: Buy Pro Subscription Product 2739).
Key Rules of Volume and Price Action in Trading
To analyze market trends accurately, traders follow four foundational volume rules:
- Price Up + Volume Up (Strong Bullish Trend): When a stock rises on heavy volume, buyers are in control. In fact, institutional accumulation is taking place. Therefore, the rally is likely to continue.
- Price Up + Volume Down (Weak Rally Warning): When a stock rises on declining volume, buying enthusiasm is drying up. Consequently, the rally lacks institutional support and may reverse near key support and resistance levels.
- Price Down + Volume Up (Strong Bearish Trend): When a stock drops on heavy volume, aggressive institutional selling is occurring. As a result, avoid buying the dip prematurely.
- Price Down + Volume Down (Healthy Pullback): When a stock experiences a minor pullback on low volume, selling interest is weak. Therefore, low-volume dips in an uptrend offer low-risk buying opportunities.
Confirming Breakouts with Volume Analysis
Breakout trading is one of the most popular strategies on the NSE and BSE. However, false breakouts are common. In fact, retail traders often get trapped when price breaks resistance without volume backing.
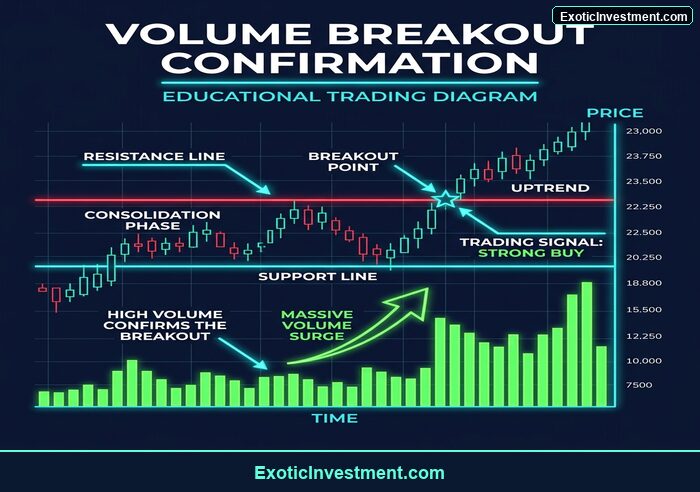
Illustration 2: High Volume Resistance Breakout Confirmation Diagram
For instance, when a stock breaks above a 52-week high or chart pattern resistance, check the volume histogram. If volume is 2 to 3 times higher than the 20-day average, institutional buyers are participating. Consequently, the breakout is genuine and offers a high-win-rate trade. Use our automated Intraday Breakout Stock Scanner to spot breakout candidates.
Spotting Reversals with Volume Divergence
Volume divergence occurs when price and volume move in opposite directions. Specifically, it acts as an early warning signal that the current trend is exhausting.
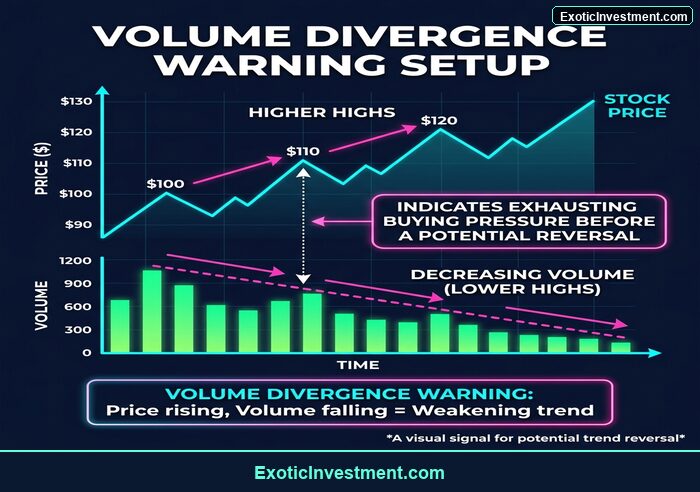
Illustration 3: Bearish Volume Divergence Warning Setup Diagram
For example, if a stock makes a new high while volume bars are steadily shrinking, buying momentum is weakening. Consequently, a sharp trend reversal often follows. Combine volume divergence with momentum oscillators detailed in our RSI indicator guide. If you hold digital assets alongside stocks, track your overall crypto returns using a crypto portfolio tracker from Emintage.
Mastering Volume and Price Action in Trading Strategies
Now, let us explore practical trading strategies using volume and price action:
Strategy 1: The High-Volume Breakout Retest
Firstly, wait for price to break above key resistance with a massive volume spike. However, do not chase the breakout candle. Instead, wait for price to pull back to the breakout level on low volume. Once a bullish Hammer forms at support, enter the trade with a tight stop loss. You can learn reversal candle setups in our guide on mastering chart patterns in stock trading.
Strategy 2: The Volume Climax Reversal
Secondly, look for an unusually massive volume spike after a prolonged downtrend. In fact, an extreme volume spike at market bottoms indicates panic capitulation, where weak hands sell to strong institutional buyers. Consequently, a powerful trend reversal follows.
Advanced Volume Indicators: OBV and Volume Profile
Furthermore, technical traders use specialized volume indicators to confirm price trends. In fact, these tools provide deeper insight into institutional accumulation:
1. On-Balance Volume (OBV)
Firstly, On-Balance Volume (OBV) is a cumulative momentum indicator. Specifically, OBV adds volume on up days and subtracts volume on down days. When OBV makes higher highs while price consolidates, institutional accumulation is occurring. To confirm moving average trends alongside OBV, read our guide on moving averages for trend confirmation.
2. Volume Spread Analysis (VSA)
Secondly, Volume Spread Analysis (VSA) evaluates the relationship between candle spread and trading volume. For instance, a narrow-range candle with extremely high volume indicates institutional absorption. Therefore, VSA signals major market turning points before conventional price patterns form.
Real-World Case Studies in the Indian Stock Market
Let us examine practical volume case studies from top NSE stocks:
1. Nifty 50 Index Futures
For example, during major Nifty breakouts above psychological levels, trading volume on futures contracts increases by 40% to 60%. Consequently, high volume confirms institutional participation, sustaining multi-week rallies.
2. High-Beta Sector Stocks
Similarly, when banking or IT stocks break out of monthly consolidation patterns, volume expansion validates the move. However, if a breakout occurs on low volume, retail traders face severe whipsaw risks. Check stock valuation metrics in our guide on P/E ratio valuation metrics.
Intraday Volume Analysis for Nifty and Bank Nifty Traders
Intraday traders on the NSE require specialized volume techniques. Specifically, monitoring 5-minute and 15-minute volume spikes provides immediate trade signals:
- Opening Bell Volume Spikes: During the first 15 minutes of trading (9:15 AM to 9:30 AM), volume is highest. In fact, high opening volume sets the daily trend direction.
- Mid-Day Volume Dry-Up: Between 11:30 AM and 1:30 PM, trading volume typically decreases. Consequently, avoid taking new breakout trades during low-volume mid-day consolidation.
- Closing Hour Surge: Finally, between 2:30 PM and 3:30 PM, institutional traders execute portfolio adjustments. Therefore, late-afternoon volume surges signal overnight trend momentum.
Future Roadmap: What’s Next in Trading
Once you master volume and price action, your next step is learning derivative trading strategies. Specifically, explore our upcoming guides on:
- Introduction to Futures and Options (F&O): Learn derivative contract basics and leverage mechanics in our upcoming lesson on Futures and Options.
- Options Buying vs. Options Selling: Compare risk-reward profiles between option buyers and option sellers in our upcoming options breakdown.
- Option Chain Analysis: Master open interest data and option strikes in our upcoming option chain guide.
Risk Management and Calculator Integration
No volume signal guarantees a 100% win rate. Therefore, risk management is essential on every trade:
- Set Stop Losses: Use our Stop Loss Calculator to define your exact rupee risk per share.
- Calculate Trading Fees: Estimate transaction costs using the Zerodha Brokerage Calculator or Upstox Brokerage Calculator.
- Calculate Net Returns: Calculate net profit targets using our Stock Profit Calculator.
- Passive Wealth Alternatives: If you prefer long-term compounding over active trading, explore why stock market investment is better than other investments. Calculate monthly returns using the Groww SIP Calculator or build passive cash flow with dividend investing in India.
If you maintain a multi-asset portfolio holding digital assets alongside stocks, manage your tax obligations with a crypto tax calculator from Emintage, or project crypto trade profits with a bitcoin profit calculator.
Frequently Asked Questions
Q: Why is volume important in price action trading?
A: Volume represents real institutional buying and selling conviction. Without volume, price movements lack momentum and can easily fail.
Q: How do I identify unusual trading volume?
A: Compare the current volume bar against the 20-day simple moving average of volume on your chart. Volume 2x or 3x higher than average is considered unusual volume.
Q: Where can I get structured technical analysis training in Kannada?
A: Enroll in our Technical Analysis in Kannada Course or read our bestselling Kaliyiri Share Market Book.
In summary, mastering volume and price action in trading gives you a significant edge in Indian equities. Furthermore, always verify high-volume breakout setups with risk-to-reward ratios before placing trades.

Trackbacks/Pingbacks