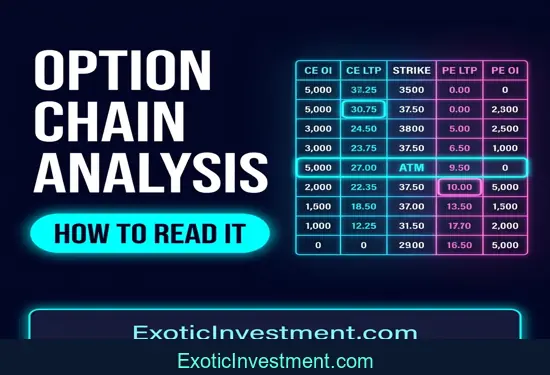
Introduction to Option Chain Analysis in India
Welcome to our comprehensive guide on option chain analysis India. If you want to trade Nifty, Bank Nifty, or stock options successfully, learning to read options data is essential. In fact, option chain analysis provides real-time insights into what institutional traders are doing behind the scenes.
Before diving into option chains, make sure you understand the basics of derivatives. For instance, read our guide on introduction to futures and options. Furthermore, you will need a solid grasp of technical chart setups. Specifically, check our guides on intro to technical analysis and support and resistance levels. Without understanding chart support and resistance, option chain data can be confusing.
What is Option Chain Analysis India?
Firstly, an option chain is a matrix that lists all available strike prices for a specific underlying asset. Specifically, it displays call options on the left and put options on the right. Therefore, conducting systematic option chain analysis India allows you to observe open interest, option premium prices, and implied volatility across multiple strikes.
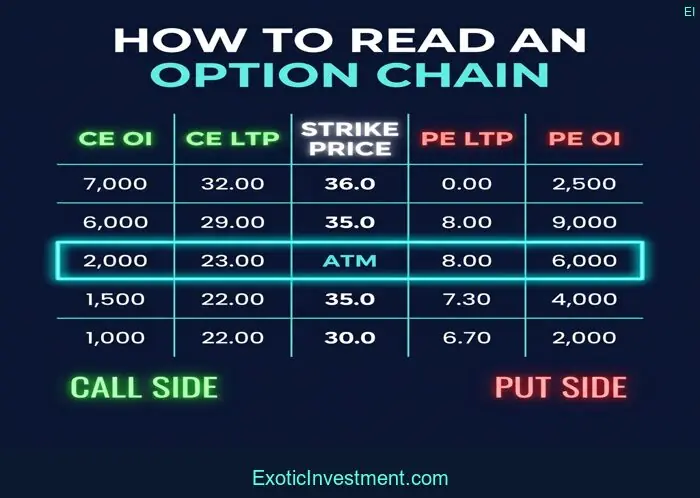
Illustration 1: Understanding Call and Put Sides of the Option Chain
In addition, option chains reveal where option writers are concentrating their capital. Because institutions are the primary option sellers, tracking their positions is vital. Consequently, we treat high concentrations of open interest as major market boundaries.
Master Technical Analysis & Trading: Recommended Courses & Books
For traders seeking structured derivatives training, we offer dedicated educational resources. In addition, these courses provide practical, step-by-step market training:
Recommended Trading Courses & Premium Subscriptions:
- Options Buying Course in Kannada: Master Nifty and Bank Nifty option buying setups step-by-step: Options Buying Course in Kannada.
- Technical Analysis in Kannada Course: Learn chart reading, indicators, and volume analysis: Technical Analysis in Kannada Course.
- Kaliyiri Share Market Book: Build your stock market foundation and wealth creation path: Kaliyiri Share Market Book.
- Basics of Stock Market Course: Learn the core fundamentals of stock investing: Basics of Stock Market Course.
- Multibagger Stocks & Pro Subscription (Product 2739): Access premium stock picks, research reports, and pro trader alerts: MultiBagger Plus Courses & Pro Tools Annual Subscription (Direct checkout: Buy Pro Subscription Product 2739).
Understanding Open Interest in the Option Chain
Open Interest (OI) represents the total number of outstanding option contracts that have not been settled or closed. Specifically, when analyzing the option chain, we focus on where OI is growing. In fact, high OI levels indicate major institutional commitments.
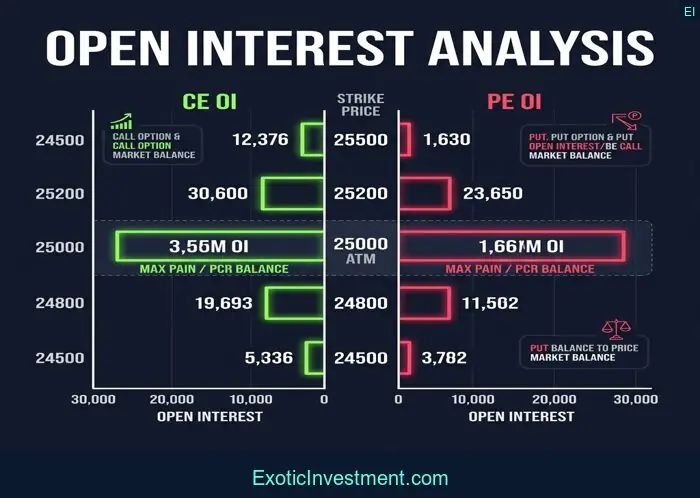
Illustration 2: Open Interest Bar Chart Analysis
For example, a high call OI at a specific strike price acts as strong resistance. Conversely, a high put OI acts as strong support. If you want to understand how volume spikes confirm these price levels, read our guide on volume and price action in trading. Furthermore, monitoring changes in OI helps you avoid trading against institutional momentum.
Put Call Ratio (PCR) Explained
The Put Call Ratio (PCR) is calculated by dividing total Put Open Interest by total Call Open Interest. Therefore, PCR is a key sentiment indicator. Specifically, a rising PCR indicates bullishness, while a falling PCR indicates bearishness.
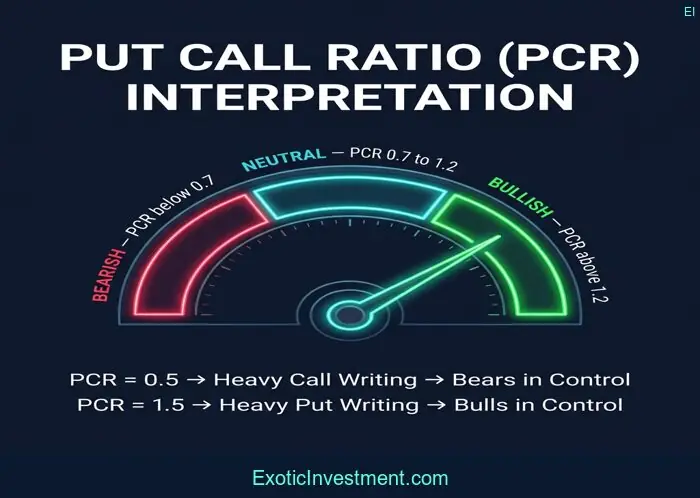
Illustration 3: Put-Call Ratio (PCR) Sentiment Meter
For instance, an extremely high PCR (above 1.4) suggests the market is overbought and due for a pullback. Conversely, an extremely low PCR (below 0.6) suggests the market is oversold. In addition, you should combine PCR signals with other momentum indicators. For example, read our guide on the RSI relative strength index guide. If you hold digital assets alongside your stocks, track your overall wealth with the crypto portfolio tracker from Emintage.
How to Identify Support and Resistance from Option Chains
Locating support and resistance levels is the primary goal of conducting option chain analysis India. Because option sellers have deep pockets, their positions define price boundaries. Therefore, the strike price with the highest Put OI serves as crucial support. Conversely, the strike price with the highest Call OI acts as formidable resistance.
Furthermore, these levels shift dynamically. For example, if you notice call writers unwinding their positions at a resistance strike, a bullish breakout is highly likely. To confirm these breakout patterns, read our guide on mastering chart patterns in stock trading. In addition, you should monitor volume expansion alongside OI shifts.
Understanding Max Pain Theory
Max Pain Theory assumes that most option buyers lose their premium upon expiration. Because institutional option sellers have massive capital, they tend to pin the spot price. Therefore, the Max Pain point is the strike price where option buyers experience maximum financial loss. Consequently, the underlying asset often gravitates toward this level on expiry day.
Moreover, calculating Max Pain involves summing the intrinsic value of all options at each strike. To understand how option premiums decay as they approach expiry, review our guide on the moving averages trend guide. Furthermore, tracking Max Pain is highly effective during monthly expiry weeks.
Practical Nifty Option Chain Reading Examples
Let us look at a practical scenario. Suppose Nifty is trading at 25,000. Upon checking the option chain, you notice massive call writing at 25,200. Therefore, 25,200 acts as immediate resistance. Because the call sellers do not expect Nifty to cross 25,200, they are aggressively collecting premium.
However, if Nifty breaks above 25,200 with rising volume, these call writers will be forced to cover. Consequently, a rapid short-squeeze will trigger a sharp rally. Therefore, you can plan your entries around these breakout points. In addition, use our Stop Loss Calculator to define your exact rupee risk per share.
Risk Management and Position Sizing
No option chain signal is 100% guaranteed. Therefore, managing risk is essential on every trade:
- Define Capital Risk: Calculate your exact fees using the Zerodha Brokerage Calculator or Upstox Brokerage Calculator.
- Calculate Net Returns: Track trade payouts using our Stock Profit Calculator.
- Invest Systematically: If active trading is too stressful, explore passive compounding. For example, check why stock market investment is better than other investments, calculate SIP returns with the Groww SIP Calculator, or build passive cash flow with dividend investing in India.
If you hold cryptocurrencies alongside traditional equities, calculate your capital gains tax with a crypto tax calculator from Emintage, or estimate potential returns with a bitcoin profit calculator.
Advanced Option Chain Analysis India: Volatility Skew
Furthermore, professional traders analyze the volatility skew. Specifically, volatility skew describes the difference in implied volatility (IV) between different strike prices. When doing option chain analysis India, you will notice that out-of-the-money puts often have higher IV than out-of-the-money calls.
Because portfolio managers buy puts to hedge downside risks, put demand rises during market uncertainty. Consequently, this hedging activity bids up put premiums and increases IV. Therefore, analyzing skew helps you identify market anxiety levels before they appear on the price charts.
Common Pitfalls in Option Chain Analysis India
While option chain data is extremely powerful, beginners frequently fall into common trading traps. Specifically, avoid these major mistakes:
- Trading Illiquid Stock Options: Firstly, stock options on smaller companies have very low trading volume. Consequently, the bid-ask spread is wide, and open interest signals are unreliable. Therefore, focus your option chain analysis on highly liquid assets like Nifty 50 and Bank Nifty.
- Relying on Outdated Data: Secondly, option chain data on free portals is delayed by 1 to 5 minutes. During highly volatile events, this delay can be dangerous. Therefore, always use live terminal data from your broker to make real-time decisions.
- Ignoring the Overall Price Trend: Finally, never take trades purely based on high OI levels. If Nifty is in a strong bullish trend, shorting near resistance is high risk. Therefore, always align your derivatives data with technical price action.
Option Chain Data Interpretation for Intraday Scalping
Furthermore, intraday scalpers can use rapid option chain analysis India setups for quick entries. For instance, monitoring changes in Open Interest every 5 minutes reveals institutional buyer dominance. In fact, sudden surges in put writing indicate strong immediate price floors. Conversely, massive call additions suggest a cap on upside progress. Consequently, scalpers can execute trades with tight stop losses near these emerging zones.
Frequently Asked Questions
Q: What is the best time to do option chain analysis India?
A: Intraday traders should check the option chain every 15–30 minutes to track OI shifts. However, long-term traders can analyze end-of-day data for weekly setups.
Q: Is option chain data sufficient to trade?
A: No, derivatives data should always be combined with technical chart analysis. Therefore, use OI data to confirm your price action levels.
Q: Where can I learn Nifty and Bank Nifty option buying?
A: You can enroll in our Options Buying Course in Kannada to master directional trading strategies.
In summary, conducting systematic option chain analysis India is crucial for directional option traders. Furthermore, always verify open interest shifts with price action breakouts before initiating trades.
In conclusion, mastering option chain analysis India is an essential step for serious derivative traders. By continuously observing how Open Interest shifts, you can make informed decisions and protect your capital from sudden market movements.
