Mastering the day chart is the definitive turning point for retail traders transitioning from chaotic gambling to disciplined institutional market execution. Across Dalal Street, amateur participants get blinded by high-speed 1-minute and 5-minute ticks, reacting emotionally to sudden intraday fakeouts. However, seasoned fund managers and professional proprietary desks anchor their strategic execution firmly around daily timeframe price discovery.
Listen, boss, every single daily candlestick encapsulates an entire session of intense institutional combat between aggressive bulls and relentless bears. When you step back from noisy intraday gyrations, true supply and demand imbalances reveal themselves with unmatched clarity. Before committing capital to technical setups, reviewing market fundamentals in our foundational guide to basic stock market terms ensures strict emotional control.
Here is the real truth: the daily chart strips away algorithmic noise, providing clean swing setups with superior risk-to-reward metrics. In addition, tracking multi-day breakouts allows retail traders to capture significant 15% to 35% momentum swings without staring at screens all day. You can project disciplined wealth compounding goals with our interactive sip calculator.
What is a Day Chart: Core Anatomy and Mechanics
A day chart represents financial asset price movement where every single candlestick or bar depicts precisely one complete trading day. On the National Stock Exchange (NSE) and Bombay Stock Exchange (BSE), a daily bar captures trading action from 9:15 AM to 3:30 PM IST. Specifically, each candle plots four critical data points: the opening price, the highest high, the lowest low, and the final official closing price.
Among these four metrics, the daily closing price holds supreme significance for institutional market participants. For example, large domestic mutual funds, foreign portfolio investors (FPIs), and bank treasuries evaluate portfolio values based on official daily closing prints. To understand broader market structures across Dalal Street, explore our deep-dive analysis on the bazar chart.
A classic Kannada proverb wisely states: “ಆತುರಗಾರನಿಗೆ ಬುದ್ಧಿ ಮಟ್ಟ” (Aaturagaaranige buddhi matta — an impatient person always suffers from impaired judgment). Similarly, impulsive traders who trade erratic 1-minute intraday bars repeatedly fall into institutional liquidity traps. Therefore, adopting a disciplined daily perspective restores clarity, patience, and strategic decision-making.
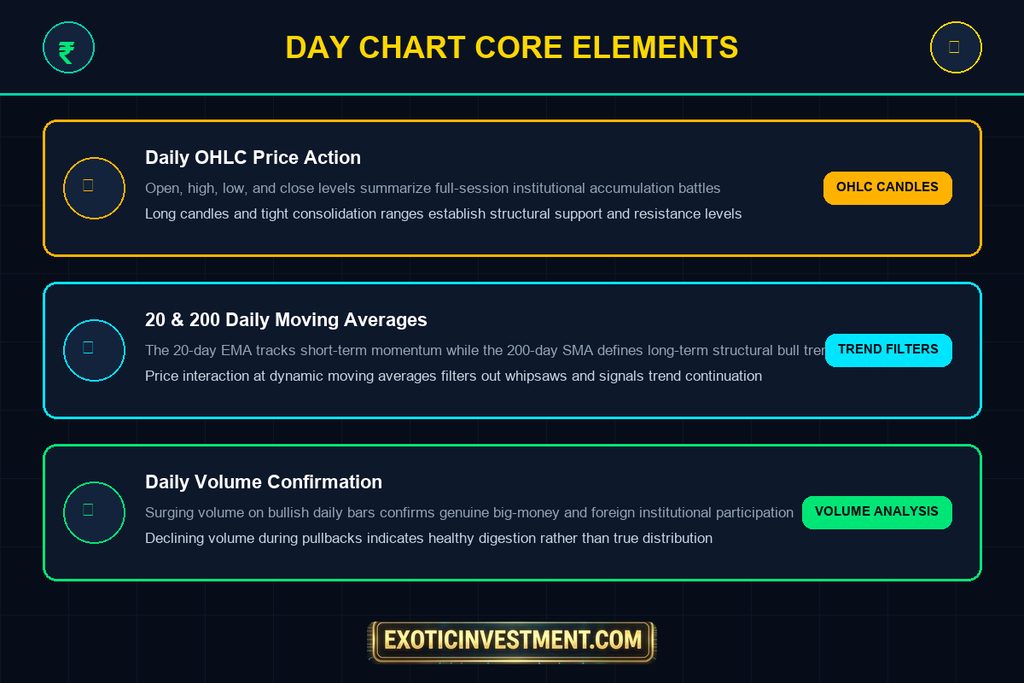
Illustration: 3 Core Technical Building Blocks of Professional Day Chart Analysis
Day Chart vs Intraday Chart: Why Big Money Trusts the Daily Timeframe
Retail traders frequently ask why proprietary trading desks prioritize the daily timeframe over fast intraday charts. The answer lies in market micro-structure, transaction friction, and institutional liquidity execution. Specifically, institutional funds managing thousands of crores cannot execute full positions within a 5-minute candle without causing massive price slippage.
Consequently, institutional accumulation and distribution campaigns unfold over several consecutive weeks on the daily chart. In contrast, intraday charts are dominated by algorithmic high-frequency trading (HFT) bots designed to hunt retail stop-losses. To analyze corporate financial strength alongside chart patterns, review our detailed tutorial on how to read a balance sheet.
Let’s examine the math: hyperactive intraday trading bleeds capital through brokerage charges, exchange turnover fees, and Securities Transaction Tax (STT). In contrast, swing trading daily charts dramatically cuts transaction friction, allowing compounding to work effectively. To calculate your actual net trading profit after exchange fees, apply our free brokerage calculator.
| Trading Dimension | Intraday Timeframe (5-Min / 15-Min) | Daily Day Chart (EOD Analysis) |
|---|---|---|
| Algorithmic Market Noise | Extremely High (Frequent Fakeouts) | Extremely Low (Clean Structural Trends) |
| Institutional Participation | Algorithmic bots & retail scalpers | Mutual funds, FPIs, & long-term capital |
| Pattern Reliability | Low (40% to 50% historical win-rate) | High (65% to 75% when volume confirmed) |
| Screen Time Requirement | Continuous 6 hours daily monitoring | Only 30 minutes of End-of-Day scanning |
First, daily charts grant traders peaceful evenings without continuous anxiety over tick-by-tick fluctuations. Second, swing setups identified on daily candles provide wide profit targets that comfortably absorb occasional overnight gap-downs. Therefore, transitioning to daily chart swing trading represents the most sustainable path for working professionals.
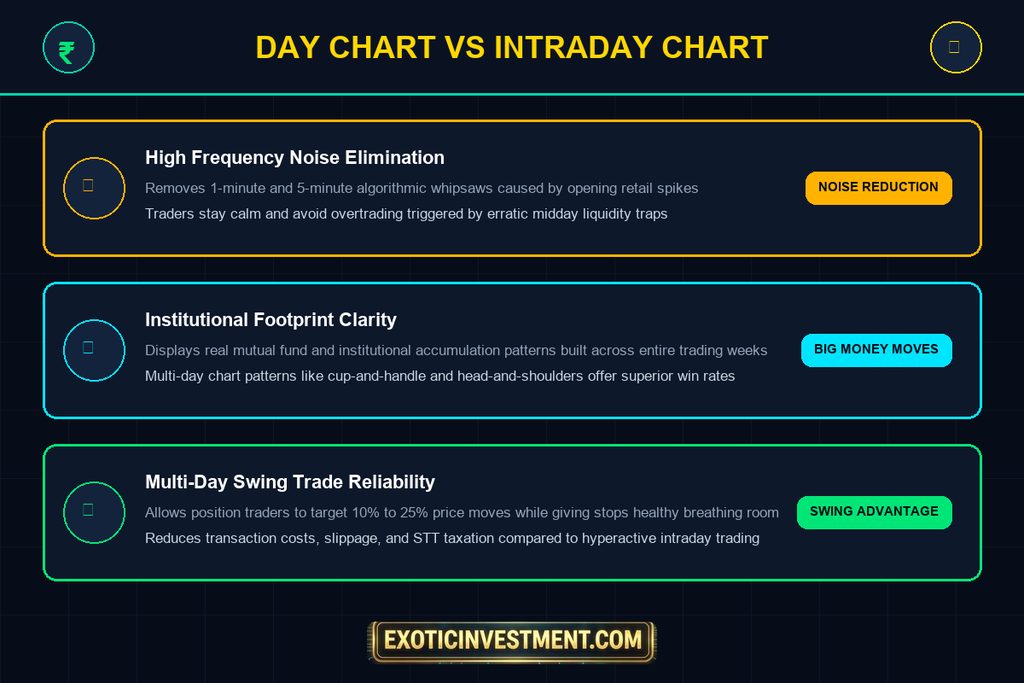
Illustration: Structural Edge and Noise Reduction of Daily Charts Compared to Intraday Ticks
Essential Indicators for Day Chart Analysis: 20 EMA and 200 SMA
While bare candlestick price action remains the foundation, combining moving averages creates a powerful trend filter. In particular, professional Dalal Street desks rely on the 20-day Exponential Moving Average (EMA) and the 200-day Simple Moving Average (SMA). The 20 EMA captures short-term momentum, acting as dynamic support during strong trending phases.
Meanwhile, the 200-day SMA serves as the definitive dividing line between long-term bull markets and secular bear markets. For instance, when a quality stock trades above its rising 200-day SMA, pullbacks toward the 20 EMA offer low-risk swing entries. To evaluate company valuations alongside technical setups, explore our dedicated pe ratio calculator.
In addition, volume analysis is non-negotiable when validating daily chart breakout candles. When a stock breaks out above multi-month resistance on volume that exceeds twice its 50-day average, institutional accumulation is confirmed. You can plan disciplined multi-year equity investments using our interactive cagr calculator.
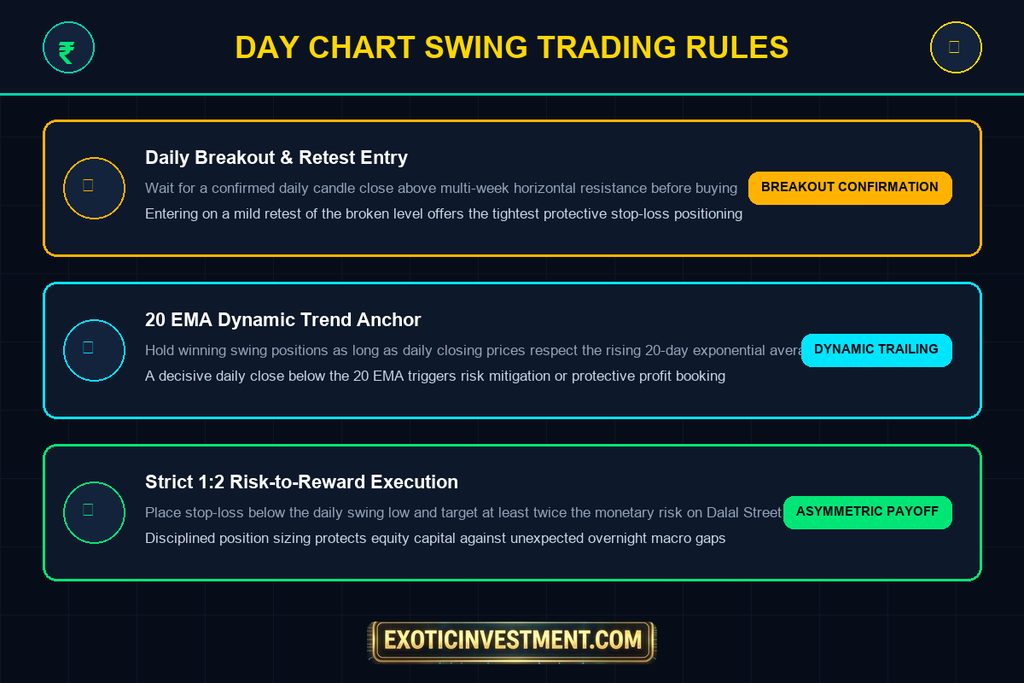
Illustration: 3 Golden Rules for High-Probability Swing Trading on the Daily Chart
High-Probability Daily Chart Trading Strategies
Executing profitable trades on the daily chart requires a systematic rule-based framework rather than emotional guessing. Below are three battle-tested swing trading setups employed by proprietary equity desks across Indian markets:
1. The Daily Resistance Breakout and Retest
First, identify a stock that has formed a clear horizontal resistance ceiling over at least four to six weeks. Wait for a decisive daily candle close above resistance accompanied by surging trading volume. Next, enter your position either on the breakout close or on a subsequent shallow pullback retesting the broken resistance level.
Place your protective stop-loss just below the breakout candle’s low or beneath the retest swing support. By following this entry rule, your monetary risk remains strictly defined while leaving upside targets wide open. To forecast future growth expectations embedded in current prices, test our reverse cagr calculator.
2. The 20 EMA Pullback in a Confirmed Uptrend
Second, scan for stocks that are steadily trading above both their 50-day and 200-day moving averages. When the stock experiences a healthy two-to-three-day price digestion toward its rising 20 EMA, watch for bullish reversal candlesticks. For example, a daily hammer or bullish engulfing candle formed directly at the 20 EMA signals immediate trend continuation.
Enter on the breakout of that reversal candle’s high with a protective stop-loss below the candle’s low. This setup delivers exceptional risk-to-reward ratios because your entry occurs near institutional support. For investors seeking passive index exposure alongside swing trades, study our detailed guide on how to invest in nifty 50 index fund.
3. Multi-Week Base Breakout (Cup and Handle & Flat Bases)
Third, institutional funds accumulate substantial share quantities within tight volatility consolidation bases lasting several months. When price tightens into a contraction pattern on declining volume, selling pressure dries up completely. Subsequently, an expansion bar breaking out of the base triggers a sustained multi-month trending rally.
To deepen your technical charting foundation, explore structured reading recommendations in our curated list of best trading books. In addition, serious market participants can sharpen their execution through our professional technical analysis course.
Risk Management and Position Sizing on Daily Timeframes
No technical pattern guarantees profits without mathematically sound risk management and position sizing protocols. Because daily candlestick swings are wider than intraday ticks, stop-loss distances in percentage terms will be larger. Therefore, traders must reduce their overall position size to ensure their absolute rupee risk remains strictly between 1% and 2% of total capital.
For example, if you manage an active trading account of ₹10,00,000, your maximum allowable loss per trade should never exceed ₹10,000. If your technical stop-loss on a daily chart setup requires an 8% distance, your position allocation should be capped accordingly. To estimate long-term capital compounding from disciplined systematic investing, try our online step up sip calculator.
In addition, global crypto market traders can explore advanced automated analytics and digital asset calculators at eMintage to diversify modern portfolios. Meanwhile, equity traders building long-term wealth can also review small-cap growth stories like aeroflex industries share price and overseas dual listings like indian adr.
Common Mistakes to Avoid When Reading Day Charts
Even experienced market participants make common psychological errors when analyzing daily charts. Being aware of these pitfalls protects your hard-earned capital from unnecessary drawdowns:
- Acting Before the Daily Candle Closes: Entering trades midday at 11:30 AM based on what looks like a breakout often leads to buying false spikes that reverse by 3:15 PM.
- Ignoring Volume Confirmation: Breakouts occurring on thin, below-average volume lack institutional sponsorship and frequently collapse back into the base.
- Fighting the 200 SMA Macro Trend: Attempting to buy daily bullish candles on stocks trading below a declining 200-day moving average carries poor odds.
- Excessive Margin Debt: Relying on borrowed broker margin on daily swing trades exposes accounts to devastating overnight gap-risk.
To plan disciplined systematic profit withdrawals during retirement or passive income phases, test our interactive swp calculator. In addition, learn how automated equity investing builds disciplined wealth through our guide on what is stock sip.
Frequently Asked Questions About Day Charts (FAQ)
What is the best timeframe to combine with a day chart?
The weekly timeframe is the single best companion for daily chart analysis. Specifically, reading the weekly chart establishes the overarching primary trend, while the daily chart pinpoints precise swing entries and risk levels.
Can beginners use the day chart for intraday trading?
Yes, professional intraday traders always analyze the day chart before the market opens at 9:15 AM IST. By identifying key daily support, resistance, and prior day high-low levels, day traders know exactly where major battles will occur.
How does volume confirm a daily chart breakout?
A legitimate breakout requires daily volume to expand significantly above the 50-day average volume line. When volume surges 1.5x to 3x normal levels, it signals massive institutional accumulation rather than retail speculation.
Is the day chart suitable for working professionals?
Absolutely, the day chart is the single most practical timeframe for working professionals. You simply spend 20 to 30 minutes each evening reviewing daily closing candles and setting conditional orders for the following session.
How does the 200-day moving average function on a day chart?
The 200-day SMA serves as the ultimate institutional benchmark on Dalal Street. Stocks trading above their 200-day SMA are in macro bull trends, while stocks below are in structural distribution.
Key Takeaways for Dalal Street Traders
First, daily charts eliminate erratic intraday noise, revealing authentic institutional footprints across Dalal Street. Second, combining daily candlestick patterns with the 20 EMA and 200 SMA provides an objective trend-following roadmap. Third, always wait for the official 3:30 PM closing print before confirming breakout setups.
Finally, protect your trading equity with strict 1% to 2% risk limits and patient position sizing. To plan single-tranche wealth compounding milestones, explore our lumpsum investment calculator today. Trade with patience, respect the daily trend, and let compounding build your market wealth over time.