Decoding the bazar chart is the single most vital skill for navigating volatile price action on Dalal Street. Whether you trade index options or buy delivery equities, the chart reflects the live battle between institutional capital and retail crowds. However, many aspiring traders stare at flashing numbers all day without understanding underlying order flow.
Listen, boss, trading without mastering price action is like driving on a highway blindfolded. When you understand how candlesticks, volume surges, and support levels interact, you spot high-probability setups before moves unfold. Before taking speculative intraday bets, reviewing foundational market mechanics in our guide to basic stock market terms establishes a rock-solid trading foundation.
Here is the real deal: market operators use liquidity pools and false breakouts to trap emotional participants. By learning to read raw price charts, you align your execution with big-money market institutions. In addition, calculating optimal trade allocations using our interactive position size calculator shields your account from ruinous drawdowns.
What is a Bazar Chart and How Does it Function?
In Indian market parlance, a bazar chart represents the graphical visualization of share price movement, traded volume, and open interest over time. Specifically, it aggregates every transaction executed on the NSE and BSE matching engines into structured time intervals. Consequently, traders can analyze price discovery across 1-minute, 5-minute, hourly, or daily candlestick timeframes.
Beyond simple line plots, professional trading desks rely on Japanese candlesticks to gauge momentum shifts and buyer exhaustion. For example, long upper wicks at key resistance levels indicate institutional profit-taking. To project long-term wealth compounding from patient swing holdings, explore our sip calculator.
A classic Kannada proverb wisely reminds us: “ಕಣ್ಣಿದ್ದವನು ದಾರಿ ಕಾಣುತ್ತಾನೆ, ಜ್ಞಾನವಂತನು ಭವಿಷ್ಯ ಕಾಣುತ್ತಾನೆ” (Kanniddavanu daari kaanuttaane, jnaanavantanu bhavishya kaanuttaane — one with eyes sees the path, but one with wisdom sees the future). Similarly, looking at price bars only reveals current quotes, but reading chart structure reveals future market direction. Therefore, technical chart mastery separates disciplined market winners from impulsive gamblers.
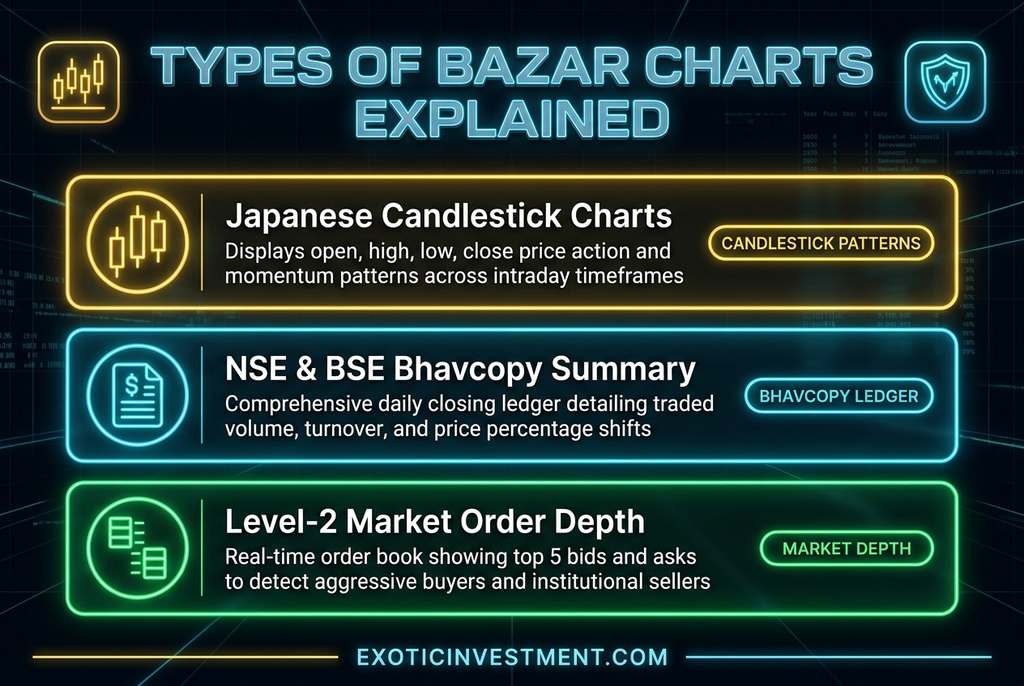
Illustration: 3 Primary Types of Bazar Charts Used Across Indian Trading Desks
Core Types of Bazar Charts: Candlestick, Bhavcopy & Order Depth
Professional traders use three distinct visual representations to interpret domestic equity trends. Each chart type reveals unique data points regarding market liquidity and institutional commitment.
Let’s keep it simple: Japanese candlestick charts highlight open, high, low, and closing prices for rapid momentum evaluation. In contrast, the official end-of-day Bhavcopy summary captures total exchange turnover and delivery volume. Meanwhile, real-time market depth displays the top five bids and asks to expose imminent supply walls.
To compare transaction expenses across discount brokers when taking intraday chart trades, evaluate charges with our zerodha brokerage calculator. In addition, understanding trade settlement rules from our guide on delivery and CNC trading rules prevents overnight margin penalties.
| Chart Format | Primary Data Shown | Best Used For |
|---|---|---|
| Japanese Candlestick | OHLC Body, Wicks & Realized Volume | Intraday trend trading, breakout confirmation, and swing entries |
| Daily Exchange Bhavcopy | Net Volume, Delivery % & Turnover | End-of-day institutional accumulation and delivery tracking |
| Level-2 Order Depth | Top 5 Bid & Ask Limit Orders | Scalping execution, slippage control, and detecting spoof orders |
First, candlestick patterns reflect instant crowd psychology at critical psychological price levels. Second, high delivery volume on the Bhavcopy confirms whether major institutional funds are accumulating shares. Therefore, integrating technical charts with official Bhavcopy data yields superior directional clarity.
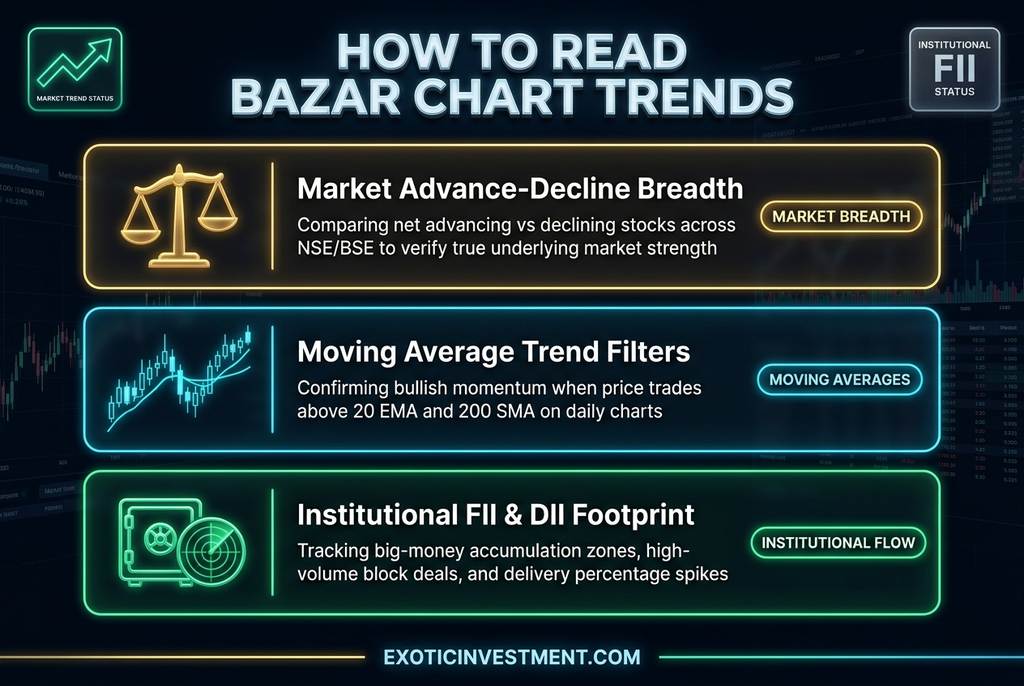
Illustration: 3 Step Framework to Analyze Underlying Trends on a Bazar Chart
How to Read Bazar Chart Trends: Breadth, Moving Averages & Volume
Analyzing price charts in isolation without broader market context frequently generates costly false signals. Specifically, elite technical analysts verify trend strength across three interlocking technical layers:
- Market Advance-Decline Breadth: Tracking the ratio of advancing stocks versus declining stocks across the NSE reveals true market participation. In fact, a rally accompanied by negative market breadth signals an impending market correction.
- Moving Average Trend Filters: Deploying the 20-period Exponential Moving Average (EMA) and 200-period Simple Moving Average (SMA) establishes trend bias. Specifically, price sustaining above rising moving averages confirms dominant institutional buying.
- Institutional Volume Spikes: Breakout candles accompanied by volume exceeding three times the 20-day average confirm institutional participation. Consequently, low-volume breakouts should be avoided as potential bull traps.
In addition, traders using extended margin funding should review interest rates and risk rules in our guide on margin trading facility rules. To compare brokerage commissions on high-frequency trading platforms, explore our upstox brokerage calculator. Therefore, combining moving averages with volume confirmation prevents painful whipsaws.
🚀 Master Price Action Trading & Options Buying
Learn how institutional desks read order book liquidity, execute high-probability breakouts, and manage risk. Master chart analysis under Dr. Ashok Kumar N Rao.
Intraday Execution: 9:15 AM Opening Range Breakout Strategy
The first 15 minutes of the Indian trading session witness massive volatility as overnight global news gets digested. Specifically, the Opening Range Breakout (ORB) strategy capitalizes on early morning order imbalances between 9:15 AM and 9:30 AM.
To execute the ORB setup with precision, follow these structured steps. Specifically, disciplined risk control determines daily trading profitability.
- Mark High and Low Boundaries: Mark the exact high and low price levels established during the initial 15-minute candle on your 5-minute chart.
- Wait for Confirmed Breakout Close: Wait for a complete 5-minute candle to close decisively outside the marked range. Never enter on an intraday wick test.
- Confirm with Volume and VWAP: Ensure the breakout candle trades cleanly above the Volume Weighted Average Price (VWAP) with expanding turnover.
- Define Fixed Invalidation Stop-Loss: Place your stop-loss order at the midpoint of the opening range or just below the breakout candle.
In addition, traders must monitor exchange-imposed circuit freezes when handling high-beta momentum stocks. Review circuit breaker mechanics in our educational guide on upper and lower circuit limits.
You can calculate realized net gains after STT and exchange fees using our stock profit calculator. Consequently, strict rule execution eliminates emotional guessing.
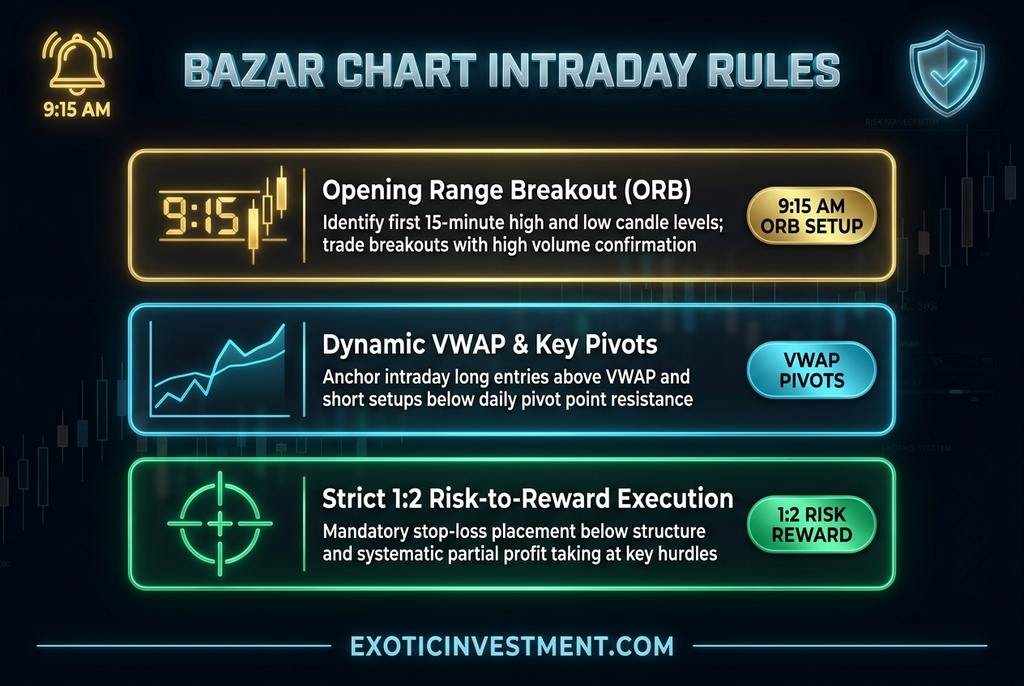
Illustration: 3 Mandatory Trading Execution Rules for Intraday Bazar Chart Setups
Support and Resistance: Finding High-Probability Turning Points
Horizontal support and resistance levels represent price zones where large commercial institutions historically stepped in to buy or sell. Specifically, when prices retest a prior breakout point, old resistance transforms into dependable new support.
In addition, combining dynamic indicators like VWAP with horizontal pivots strengthens setup probability. To project long-term compounding growth from systematic capital investments, explore our lumpsum investment calculator. In fact, checking valuation multiples with our pe ratio calculator ensures you never buy fundamentally overpriced stocks during technical rallies.
Similarly, reviewing historical price trajectory equations with our reverse cagr calculator helps you evaluate whether future growth estimates justify current chart valuations. Therefore, aligning technical support levels with fundamental value creates a durable trading edge.
Risk Management: Stop-Loss Rules and Position Sizing
Even the cleanest technical chart setup will occasionally fail when unexpected macroeconomic headlines hit the wires. Because losses are an inevitable cost of doing business, capital preservation must take priority over quick profits.
Specifically, professional risk managers enforce a strict 1% to 2% capital risk rule per individual trade. For example, if your total trading account holds ₹5 Lakh, you must never risk losing more than ₹5,000 on any single position. You can evaluate transaction costs across discount brokers using our groww brokerage calculator.
In addition, day traders must accurately estimate annual tax obligations on speculative intraday turnover. You can project your short-term and speculative business tax liabilities using our stock market tax calculator.
In fact, reviewing depository transfer processes in our guide on demat account terms prevents settlement hurdles. Therefore, strict risk management keeps you solvent through tough market phases.
💡 Frequently Asked Questions (FAQ)
What is the best timeframe to read a bazar chart for intraday trading?
The 5-minute and 15-minute timeframes offer the ideal balance between trend clarity and timely trade execution for intraday setups. In addition, traders should calculate exact position sizing before taking entry signals using our position size calculator.
How does market depth help in reading a bazar chart?
Market depth reveals the top 5 bids and asks on exchange matching engines, exposing real-time order concentration and potential institutional liquidity walls. You can evaluate trading charges across full-service brokers using our angel one brokerage calculator.
Can technical chart analysis predict stock market direction 100% of the time?
No, technical charts reflect probabilities rather than certainty, which is why disciplined stop-loss placement is mandatory on every trade. To protect trading capital during sudden price freezes, study exchange volatility rules in our guide on upper and lower circuit limits.
What is the difference between line charts and candlestick charts?
Line charts only plot closing prices, whereas candlestick charts display the complete open, high, low, and closing range along with buyer-seller momentum. In addition, reviewing basic terminology in our educational guide to basic stock market terms ensures proper technical comprehension.
How do traders calculate net profit after brokerage charges on chart trades?
Traders must deduct broker commissions, STT, exchange transaction fees, SEBI turnover charges, and GST from their gross gains. In fact, you can calculate exact net realized profits after all statutory deductions using our free stock profit calculator.