Listen, boss, have you ever seen a company report soaring sales revenue, only to watch its stock price crash 15% after earnings? That happens when retail traders look only at top-line sales without checking what is opm in share market. In fundamental equity analysis, OPM stands for Operating Profit Margin. It is the single purest measure of how efficiently a company turns raw materials and employee labor into operating cash. If a business cannot maintain healthy operating margins, any increase in raw material costs or inflation will wipe out net profits. Before checking live LTP, CMP, and ATP stock price terms, let’s keep it simple. Here is how OPM works, how to calculate it, and how to spot genuine economic moats.
What is OPM in Share Market? The Core Definition
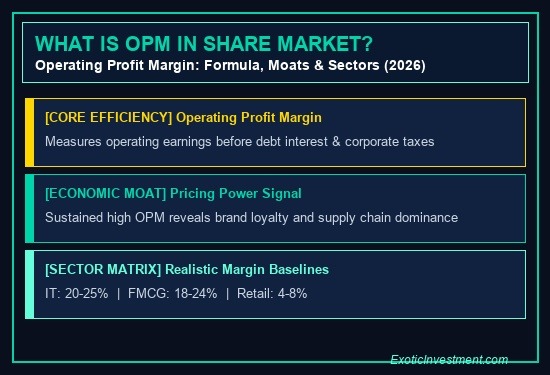
OPM stands for Operating Profit Margin. It measures the percentage of revenue left over after paying all variable operating costs of production.
Operating costs include raw materials, factory wages, electricity, freight, advertising, and administrative overheads. Crucially, OPM evaluates core profitability before deducting finance interest on bank loans and corporate income taxes.
Because OPM excludes debt financing and taxes, it reveals the raw operating health of the core enterprise. To see how operating profit flows into final shareholder take-home profit, read our detailed guide on PAT in share market and bottom line earnings.
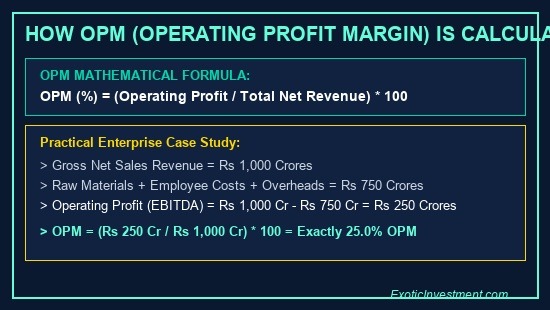
Illustration: How OPM (Operating Profit Margin) is Calculated Step by Step
The OPM Formula and a Real-World Calculation
Calculating Operating Profit Margin is straightforward. Here is the mathematical formula used by equity research analysts:
OPM (%) = (Operating Profit / Total Net Revenue) × 100
Where Operating Profit equals Total Net Sales minus Operating Expenses (Cost of Goods Sold + Employee Expenses + Other Operating Overheads).
Let’s look at an example from our trading desk:
Suppose an automobile parts maker generates ₹1,000 Crores in net sales revenue. Its raw material expenses total ₹500 Crores, employee salaries equal ₹150 Crores, and factory power costs total ₹100 Crores. Total operating expenses equal ₹750 Crores.
Operating Profit equals ₹1,000 Crores minus ₹750 Crores = ₹250 Crores.
Dividing ₹250 Crores by ₹1,000 Crores and multiplying by 100 yields an OPM of exactly 25.0%! If you trade long-term holdings, learn how delivery shares and CNC orders settle on Indian exchanges.
OPM vs NPM (Net Profit Margin): The Vital Difference
Beginning investors often confuse Operating Profit Margin (OPM) with Net Profit Margin (NPM). Knowing the distinction prevents costly valuation errors:
1. Operating Profit Margin (OPM): Evaluates business operations independent of how the company is financed. A debt-free firm and a leveraged firm can have identical OPMs if their factories operate with equal efficiency.
2. Net Profit Margin (NPM / PAT Margin): Reflects the final bottom line after paying bank loan interest and government taxes. If an enterprise has massive debt, high interest payments can crush NPM even if OPM looks spectacular.
For example, if Company A has 25% OPM but pays 15% of revenue as bank interest, its final net margin shrinks to just 7%. Company B with 20% OPM and zero debt might retain an 15% net margin. Always compare both metrics.
Evaluate overall valuation multiples with our free PE Ratio Calculator, and model capital growth using our Reverse CAGR Calculator.
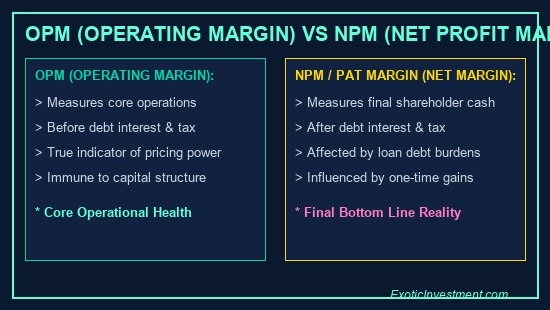
Illustration: OPM vs NPM: Core Operational Efficiency vs Final Shareholder Margin
Sector-Wise OPM Benchmarks on NSE & BSE
In our private WhatsApp community of 1,300+ traders, members often ask: What is a good OPM percentage? The answer depends entirely on the industry:
1. IT Software Services (20% to 26% OPM): IT giants like TCS and Infosys operate asset-light models with minimal physical raw materials. Their primary expense is tech talent, allowing them to enjoy high, stable OPMs.
2. FMCG & Consumer Brands (18% to 24% OPM): Companies like Hindustan Unilever and Nestle possess immense pricing power. When input costs rise, they pass price hikes to consumers, protecting their OPM.
3. Steel, Metals & Commodities (12% to 18% OPM): Commodity producers face cyclical margin swings. When global steel prices crash, their OPM compresses dramatically.
4. Retail Supermarkets (5% to 9% OPM): Retail chains like Avenue Supermarts (DMart) run on thin operating margins. However, rapid inventory turnover and huge sales volume generate high overall return on equity.
Calculate your risk-adjusted capital allocation using our free Position Size Calculator, and check your tax obligations with our Stock Market Tax Calculator.
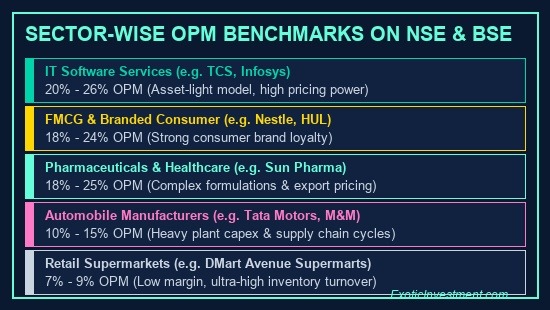
Illustration: Sector-Wise OPM Benchmarks on NSE and BSE Listed Companies
Why Expanding OPM Signals a Powerful Economic Moat
Legendary investors search for companies with expanding OPM. When a company steadily increases its OPM over 5 to 10 consecutive years, it proves two critical competitive advantages:
1. Genuine Pricing Power: The enterprise can raise product prices faster than inflation without losing customers to competitors.
2. Operating Scale Efficiency: Fixed costs remain steady while sales climb, causing operating profits to expand faster than top-line revenue.
Conversely, steadily shrinking OPM is the earliest warning sign of a dying business model. When competitors engage in price wars or substitute products emerge, margins collapse before revenue drops. Also, when volatile counters hit daily exchange limits, read our guide on circuit limits and trading halts.
Summary Checklist: How to Screen Stocks Using OPM
Here is a practical checklist used by experienced fundamental investors to screen stocks by operating margin:
- Look for 5-Year OPM Stability: Demand consistency. Avoid businesses where OPM swings wildly from 5% to 25% across economic cycles.
- Compare Against Direct Peers: Always compare a company’s OPM against its direct sector rivals rather than the broader market index.
- Audit Raw Material Trends: Watch quarterly gross margins to see if rising input commodity costs are squeezing operating profits.
- Verify Operating Cash Conversion: Ensure high OPM translates into strong operating cash flows rather than uncollected receivables.
Recommended Trading Education & Stock Market Books
If you want to master corporate balance sheet reading, financial ratio screening, and technical chart timing, structured education is your best investment:
Learn price action and candlestick setups in our Technical Analysis Course in Kannada, or build foundational market skills with our Basics of Stock Market Course. If you trade derivatives, explore our Options Buying Course in Kannada.
Kannada readers can also grab Ashok Kumar N Rao’s bestselling Kaliyiri Share Market Book, or explore the English edition on the Basics of Indian Stock Market Book page. For weekly research stock picks, subscribe to our Multibagger Stocks Annual Subscription. Also check out Emintage financial calculators for external financial modeling tools.
Summary Checklist: How to Track Margin Expansion Over Time
Here is a practical checklist used by experienced fund managers to monitor operating margins:
- Review Quarterly Gross Margin Trends: Track raw material inflation across consecutive quarters to spot early margin pressure.
- Analyze Fixed vs Variable Expense Splits: High operating fixed costs trigger rapid margin expansion once revenue crosses the break-even threshold.
- Assess Competitor Pricing Power: Verify whether the company leads industry price increases or merely follows market rivals.
- Cross-Check Inventory Turnover Rates: Fast inventory turnover protects operating margins from obsolescence and storage write-downs.
Frequently Asked Questions — What is OPM in Share Market
FAQ 1: What is the meaning of OPM in the Indian share market?
OPM stands for Operating Profit Margin. It measures the percentage of revenue that remains as operating profit after paying all manufacturing and operational expenses, but before deducting interest and taxes. Check trade costs using our free Zerodha Brokerage Calculator.
FAQ 2: What is a good OPM percentage for Indian stocks?
A good OPM depends on the industry sector. For IT software and FMCG companies, an OPM between 18% and 25% is excellent. For retail and commodity manufacturing, an OPM between 7% and 14% is typical. Read our guide on delivery shares and CNC orders.
FAQ 3: How is OPM different from EBITDA margin?
In Indian financial reporting, Operating Profit and EBITDA are often used synonymously. Both represent earnings before interest, taxes, depreciation, and amortization. Therefore, OPM and EBITDA margin generally refer to the same operating metric. Model long-term returns with our Lumpsum Investment Calculator.
FAQ 4: Can a company have a high OPM but negative net profit?
Yes! If an enterprise carries massive bank debt or issues high-interest bonds, finance charges can exceed operating profit, turning net PAT negative despite a healthy OPM. Calculate risk-adjusted capital limits using our Position Size Calculator.
FAQ 5: Where can I check the historical OPM of NSE-listed companies?
You can review multi-year OPM trends on financial research platforms like Screener.in, Trendlyne, or official annual reports filed with NSE and BSE. Learn chart setups in our Technical Analysis Course in Kannada.
FAQ 6: How are capital gains taxed when investing in high-OPM compounders?
Equities held over 12 months qualify for Long-Term Capital Gains (LTCG) taxed at 12.5% on profits exceeding ₹1.25 Lakh per financial year. Shares sold within 12 months attract STCG at 20%. Calculate your exact tax liability with our Stock Market Tax Calculator.
