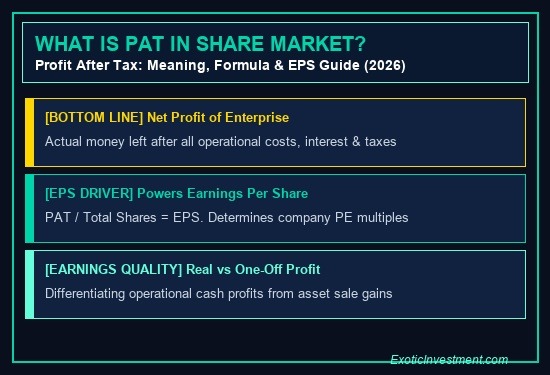
Listen, boss, every quarter during earnings season, news channels flash breaking headlines: “Tata Motors PAT surges 40%!” or “Reliance reports record quarterly PAT!” If you are serious about building long-term wealth, you must understand what is pat in share market. PAT, or Profit After Tax, is the ultimate bottom line of every listed business on NSE and BSE. Revenue looks impressive on paper, but if operating costs and debt interest wipe out earnings, shareholders end up with nothing. Before checking live LTP, CMP, and ATP stock price terms, let’s keep it simple. Here is how PAT works, how it drives Earnings Per Share (EPS), and how to screen out low-quality earnings traps.
What is PAT in Share Market? The Core Definition
PAT stands for Profit After Tax. It represents the net earnings remaining in a company after paying all operating expenses, employee salaries, depreciation, loan interest, and government corporate income taxes.
Think of PAT as the real take-home cash of the corporation. An employee looks at take-home salary after tax. Similarly, investors look at PAT to see the money belonging to shareholders.
Every listed company publishes its audited PAT figures every three months in compliance with SEBI listing regulations. To understand how equity share capital is accounted for on the balance sheet, read our complete guide on face value of shares and nominal par value.
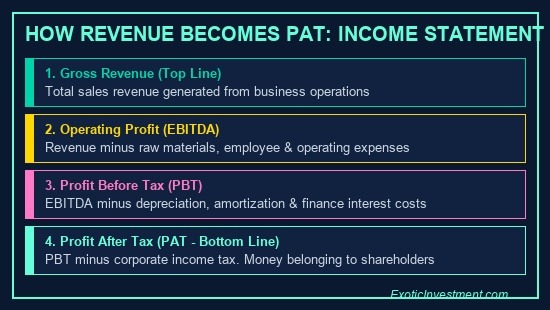
Illustration: Income Statement Journey: How Gross Sales Revenue Becomes PAT
The Income Statement Journey: From Revenue to PAT
To truly master fundamental stock analysis, you must follow the financial flow of money through the corporate income statement:
1. Top Line Revenue: The total gross revenue or turnover generated by selling goods or services.
2. EBITDA (Operating Profit): Revenue minus direct raw material costs, manufacturing expenses, sales commissions, and administrative overheads.
3. EBIT (Operating Profit After Depreciation): EBITDA minus wear-and-tear depreciation on factories, machinery, and software amortization.
4. PBT (Profit Before Tax): EBIT minus finance borrowing costs and loan interest payments paid to banks and bondholders.
5. PAT (Profit After Tax): PBT minus applicable corporate income tax. In India, most manufacturing firms pay an effective corporate tax rate of about 25.17%.
Whether you hold multi-year delivery shares or swing trade, learn how delivery shares and CNC orders settle on Indian exchanges.
How PAT Drives EPS and Stock Valuation Multiples
Why do institutional mutual funds and FIIs care so deeply about PAT? Because PAT directly powers Earnings Per Share (EPS), the single most influential variable in stock valuation!
Here is the mathematical formula used across Dalal Street:
Earnings Per Share (EPS) = Net Profit After Tax (PAT) / Total Outstanding Shares
Let’s look at a concrete numerical example:
Suppose a company generates a net PAT of ₹500 Crores and has 10 Crore equity shares listed on the exchange. Dividing ₹500 Crores by 10 Crores yields an EPS of ₹50.00 per share.
If the stock trades at ₹1,000 in the open market, its Price-to-Earnings (P/E) multiple equals 20x (₹1,000 / ₹50 = 20).
When PAT grows 25% next year to ₹625 Crores, EPS jumps to ₹62.50. Even if the valuation multiple stays at 20x, the stock price naturally rallies to ₹1,250 (20 × ₹62.50). That is how growing PAT creates multi-bagger stock returns!
Evaluate your target stock’s valuation multiple using our free PE Ratio Calculator, and model compounding returns with our Reverse CAGR Calculator.
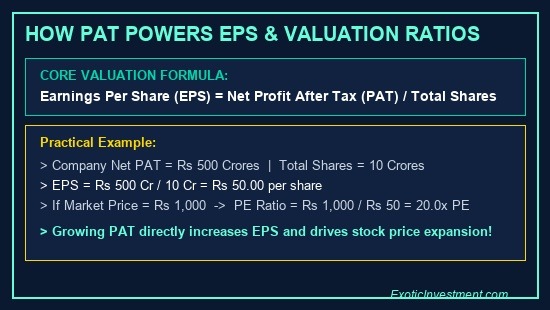
Illustration: How PAT Directly Powers Earnings Per Share (EPS) and Market Price
PAT Quality vs Accounting Traps: What Smart Investors Audit
In our private WhatsApp community of 1,300+ traders and investors, we repeatedly warn against blindly trusting headline PAT numbers. Not all profits are created equal:
1. Cash Flow from Operations (CFO) vs PAT: High-quality companies convert their accounting PAT into hard cash. If a company reports ₹100 Crores in PAT while operating cash flow is negative, customers are not paying their bills. That is a massive warning sign of aggressive revenue recognition.
2. Exceptional Gains and One-Off Profits: If a failing textile company sells its factory land in Mumbai and reports a sudden ₹200 Crore profit jump, that is NOT operational PAT! It is an exceptional item that will never repeat next quarter. Always subtract other income to evaluate core operating PAT.
3. High Debt and Rising Interest Costs: When interest rates rise, heavily indebted companies see their PBT and PAT collapse even if top-line revenue expands. Look for businesses with low debt-to-equity ratios.
Calculate your portfolio position limits using our free Position Size Calculator, and check your tax obligations with our Stock Market Tax Calculator.
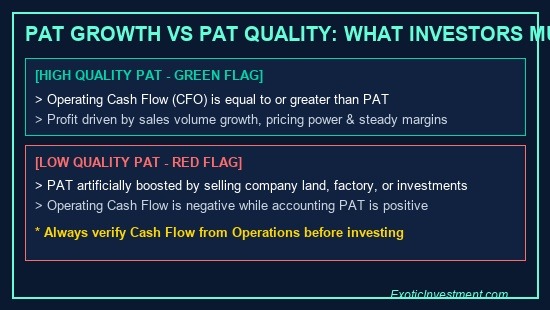
Illustration: PAT Growth vs Cash Flow Quality: Green Flags vs Red Flags for Investors
PAT Margin: How to Compare Competitors Across Sectors
To compare companies of different sizes within the same industry, analysts use the PAT Margin (Net Profit Margin):
PAT Margin (%) = (Profit After Tax / Total Revenue) × 100
For example, if an IT software company earns ₹10,000 Crores in revenue and reports ₹2,000 Crores in PAT, its PAT margin is 20%. Software businesses typically enjoy high PAT margins because they require minimal physical raw materials.
In contrast, a retail supermarket chain might report ₹50,000 Crores in revenue, but only ₹1,500 Crores in PAT (a 3% PAT margin). While retail margins are thin, massive sales volume and inventory turnover compensate for the lower margin.
Also, when price action surges toward daily exchange limits, read our complete guide on circuit limits and trading halts.
Summary Checklist: How to Audit Corporate PAT Before Investing
Here is a practical checklist used by experienced fundamental investors to evaluate company profits:
- Track 5-Year PAT CAGR: Look for consistent double-digit annual profit growth rather than volatile single-year spikes.
- Compare Operating Cash Flow: Ensure cumulative 5-year operating cash flows equal at least 80% of cumulative reported PAT.
- Screen Out Exceptional Items: Remove one-time asset sales, tax credits, and foreign exchange windfalls from your valuation models.
- Monitor Dividend Payout Ratio: Healthy, investor-friendly companies distribute 20% to 40% of their annual PAT back to shareholders as dividends.
Recommended Trading Education & Stock Market Books
If you want to master corporate balance sheet reading, financial ratio screening, and technical chart timing, structured education is your best investment:
Learn chart patterns and trend analysis in our Technical Analysis Course in Kannada, or build a rock-solid market foundation with our Basics of Stock Market Course. If you trade derivatives, explore our Options Buying Course in Kannada.
Kannada readers can also grab Ashok Kumar N Rao’s bestselling Kaliyiri Share Market Book, or explore the English edition on the Basics of Indian Stock Market Book page. For weekly research stock picks, subscribe to our Multibagger Stocks Annual Subscription. Also check out Emintage financial calculators for external financial modeling tools.
Frequently Asked Questions — What is PAT in Share Market
FAQ 1: What is the meaning of PAT in the Indian share market?
PAT stands for Profit After Tax. It represents the net profit of a company after deducting all operating costs, depreciation, debt interest, and corporate taxes. It is the final amount available to equity shareholders. Check trade costs using our free Zerodha Brokerage Calculator.
FAQ 2: How is PAT different from PBT and EBITDA?
EBITDA measures operating profit before interest, taxes, and depreciation. PBT (Profit Before Tax) deducts depreciation and interest costs. PAT deducts government taxes from PBT, representing the true bottom line. Learn how equity holdings settle in our guide on delivery shares and CNC orders.
FAQ 3: Can a company report positive PAT but run out of cash?
Yes! Because Indian companies use accrual accounting, revenue is recognized before cash is collected. If customers delay payments while the company pays suppliers, accounting PAT remains positive while bank cash vanishes. Run capital compounding models with our Lumpsum Investment Calculator.
FAQ 4: How does PAT growth impact the stock price?
Growing PAT increases Earnings Per Share (EPS). When EPS rises, institutional investors pay higher prices for the stock, expanding market capitalization. Calculate risk-adjusted capital allocation using our Position Size Calculator.
FAQ 5: Where can I find the official quarterly PAT of listed companies?
You can find official quarterly financial results on the NSE India, BSE India, or company investor relations websites. In addition, financial portals like Screener and Tijori Finance display multi-year PAT trends. Master chart setups in our Technical Analysis Course in Kannada.
FAQ 6: What taxes apply when selling shares of high PAT growth companies?
Gains from shares held over 12 months are taxed as Long-Term Capital Gains (LTCG) at 12.5% above ₹1.25 Lakh. Gains from shares sold within 12 months are taxed as STCG at 20%. Calculate your exact tax liability with our Stock Market Tax Calculator.
