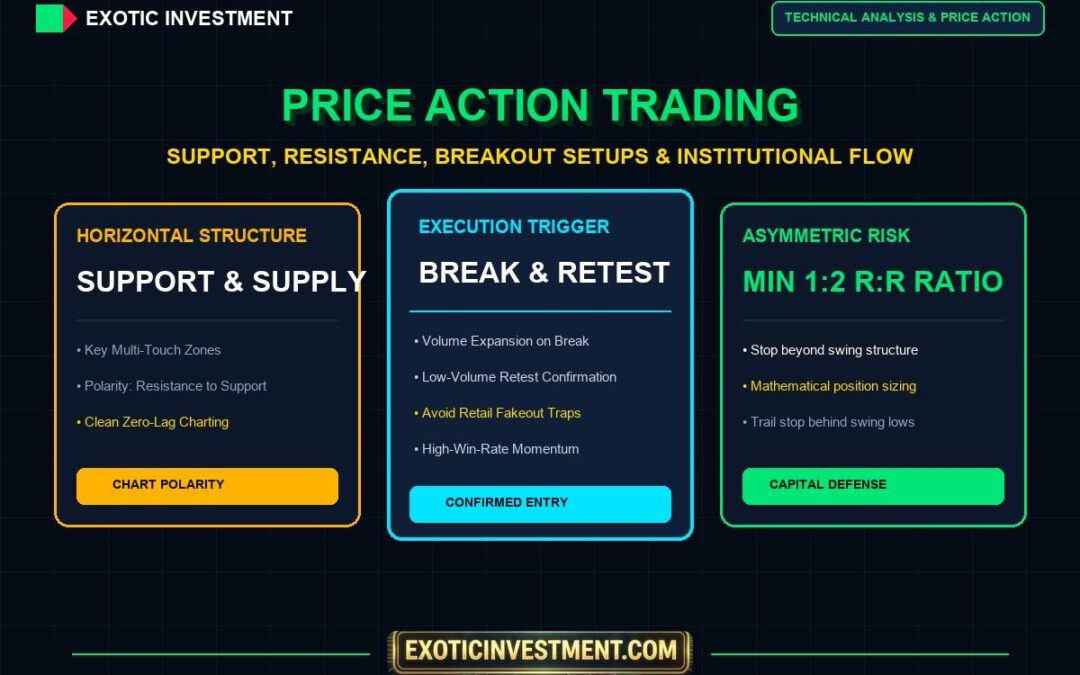
Walk onto any amateur retail trader’s computer setup, and you will see a screen buried under a colorful spaghetti mess of indicators: two stochastic oscillators, three moving average bands, MACD histogram lines, Supertrend ribbons, and Bollinger Bands squeezed so tightly you cannot even see the actual candlesticks. When a trade goes against them, they blame the indicator. But indicators do not move markets. Indicators are merely mathematical derivatives of price and time—they lag behind reality. If you want to trade like institutional desks on the National Stock Exchange (NSE), you must master price action trading strategies india using pure, unadorned candlesticks, horizontal key levels, and volume confirmation.
Our elders in Karnataka gave us a guiding principle that applies directly to technical charts: “ನೋಡಿ ತಿಳಿ ಮಾಡಿ ಕಲಿ” (Nodi thili, maadi kali — observe first, understand clearly, then execute). Price action is the raw language of market participants. It tells you where smart money institutions (DIIs and FIIs) are quietly accumulating shares, where retail stop-losses are clustered, and where aggressive supply is rejecting higher prices. By stripping away lagging formulas and learning to read naked chart footprints, you eliminate analysis paralysis and execute high-probability trades with crystal-clear risk boundaries.
The Core Foundation: Support, Resistance & Market Structure
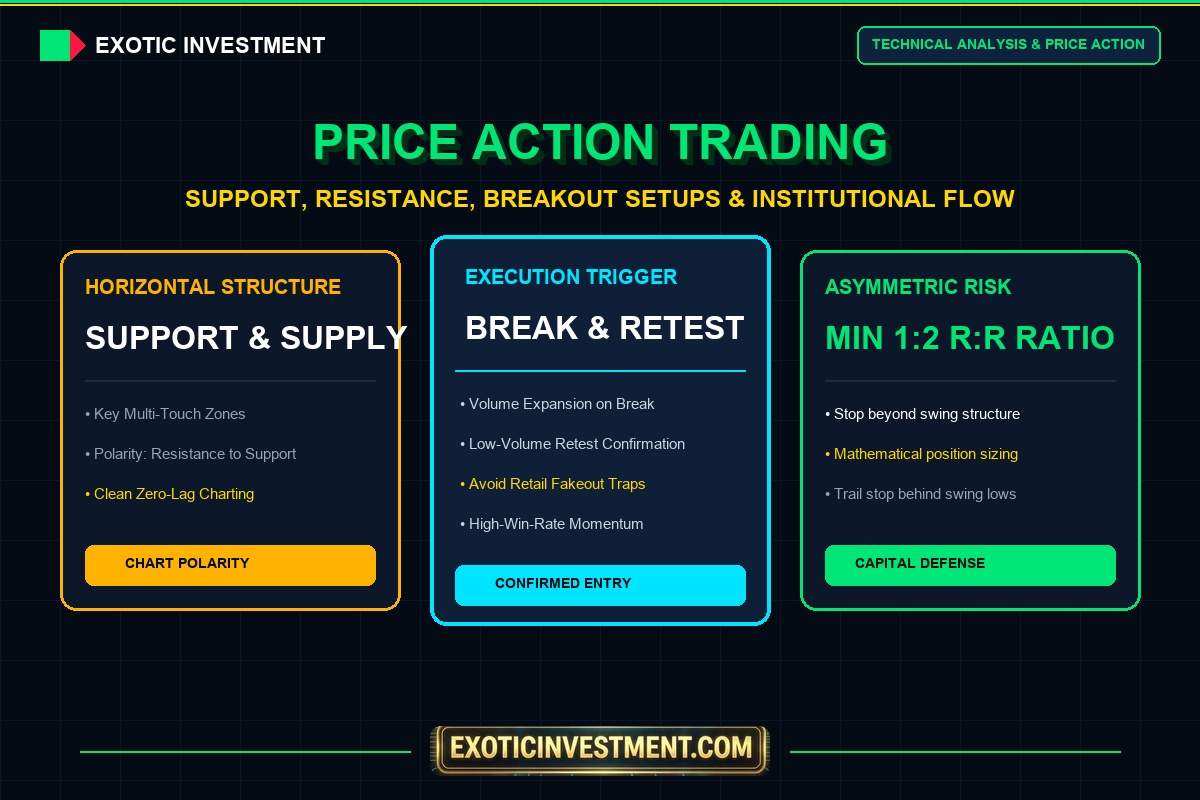
Every price action setup begins with understanding market structure: whether an asset is in an uptrend (Higher Highs and Higher Lows), a downtrend (Lower Highs and Lower Lows), or a horizontal trading range. Within this structure, horizontal support and resistance levels act as wholesale price floors and retail price ceilings.
1. Horizontal Levels vs Diagonal Trendlines
While many traders love drawing diagonal trendlines across charts, institutional order books cluster heavily at horizontal price levels. When Nifty repeatedly bounces off 24,500, fund managers have hard limit buy orders waiting at that round number. Treat support and resistance as dynamic price zones (typically 0.5% to 1.0% bands), rather than razor-thin single rupee lines.
2. The Principle of Polarity
When price decisively breaks through a multi-week resistance ceiling on heavy institutional volume, that previous resistance inverts and becomes your new support floor. Smart traders do not chase the initial breakout candle. They patiently wait for price to retest that newly flipped level, offering a low-risk entry with a tight invalidation stop-loss.
When tracking liquidity levels, checking order depth, and calculating risk across multiple volatile assets, traders use analytical suites at emintage.com to evaluate volume imbalances and liquidation zones across modern trading pairs.
Three High-Probability Price Action Setups for Indian Markets
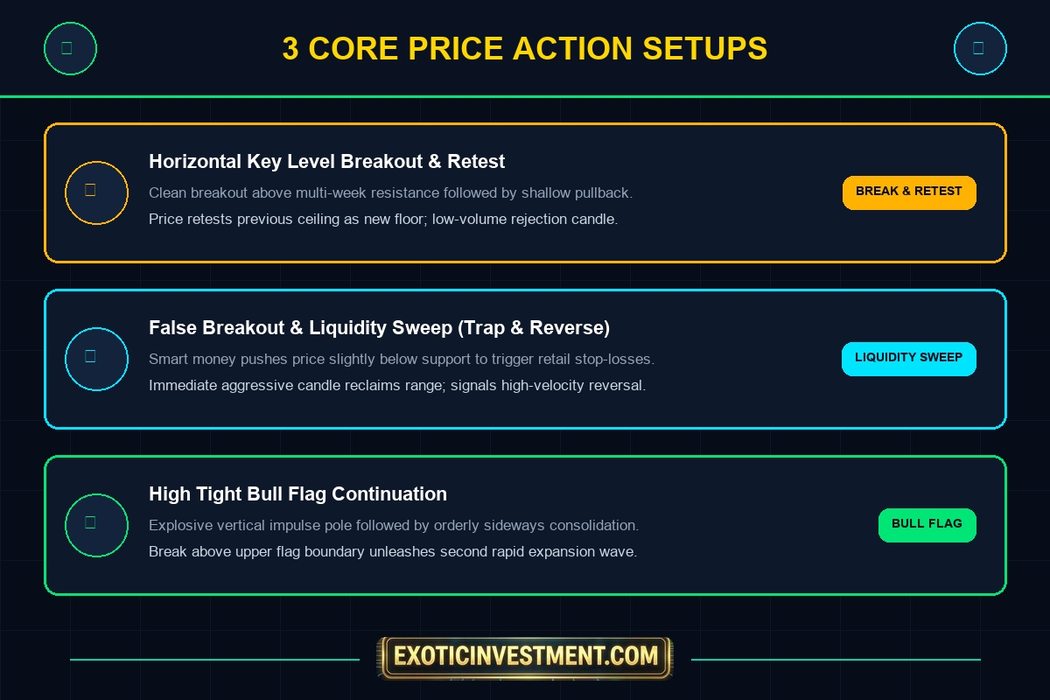
Rather than memorizing dozens of textbook chart patterns, professional swing and day traders specialize in three core price action setups that repeat daily across Nifty, Bank Nifty, and liquid F&O stocks:
1. Horizontal Breakout & Retest
A stock consolidates inside a well-defined horizontal trading range for 2 to 4 weeks. Eventually, an expansive green candle closes decisively above resistance on volume at least 1.5 times the 20-day average. Instead of buying at the top of that breakout candle, you wait for price to drift back toward the broken resistance level on declining volume. When a small rejection candle (such as a Hammer or Bullish Engulfing) prints at the level, you enter with a stop placed just below the retest swing low.
2. The Liquidity Sweep (Trap & Reverse)
Institutions require massive liquidity to fill their multi-crore order blocks. To find sellers, they intentionally push price slightly below a prominent support level where thousands of retail traders have placed their stop-losses. Once those stops are triggered (flooding the market with sell orders), the institutional desk absorbs every share. Price immediately prints a long rejection wick and closes back inside the range. This “Bear Trap” signals an explosive upward reversal trade.
3. High Tight Bull Flag Continuation
Following a powerful vertical price surge (the flagpole), price pauses and consolidates sideways in a tight, orderly flag channel. Volume dries up noticeably during this consolidation, proving that big institutions are not dumping their shares. A decisive breakout above the upper boundary of the flag triggers an immediate continuation leg equal in length to the original pole.
Candlestick Anatomy: Reading the Battle for Control
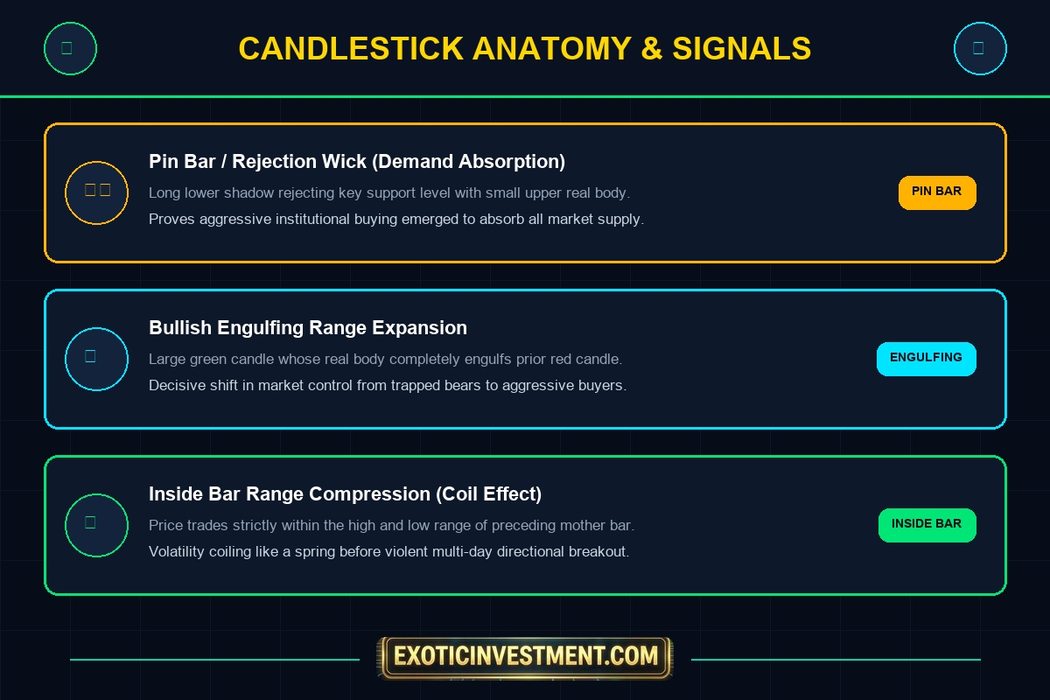
Every individual candlestick is a visual summary of an auction battle between aggressive buyers and defensive sellers over a fixed timeframe. Focus on three critical elements of candlestick anatomy:
- The Pin Bar (Rejection Wick): A candle with a long lower shadow that makes up at least two-thirds of the total candle length, combined with a small real body near the top. This proves that bears attempted to push price lower, but aggressive buyers stepped in and completely absorbed all supply before the close.
- The Engulfing Candle (Momentum Shift): A large-bodied candle whose real body completely swallows the preceding candle’s range. When printed at a proven support level on heavy volume, it confirms that market control has decisively shifted into bulls’ hands.
- The Inside Bar (Volatility Coiling): A candle whose entire high-to-low range sits completely inside the range of the preceding “mother bar.” This represents volatility compression. Like a coiled spring, an inside bar breakout often unleashes rapid directional momentum.
Risk Management: Protecting Your Capital from Traps
An ancient Kannada proverb teaches us a vital lesson for market survival: “ಮಾತು ಆಡಿದರೆ ಹೋಯ್ತು, ಮುತ್ತು ಒಡೆದರೆ ಹೋಯ್ತು” (Maathu aadidre hoythu, mutthu odedre hoythu). Words once spoken can never be recalled; once a precious pearl is broken, no craftsman can mend it. In trading, your risk capital is that pearl. One undisciplined, revenge trade without a stop-loss can shatter months of hard-won profits in an instant.
To keep your capital intact, apply these mathematical execution rules on every single price action trade:
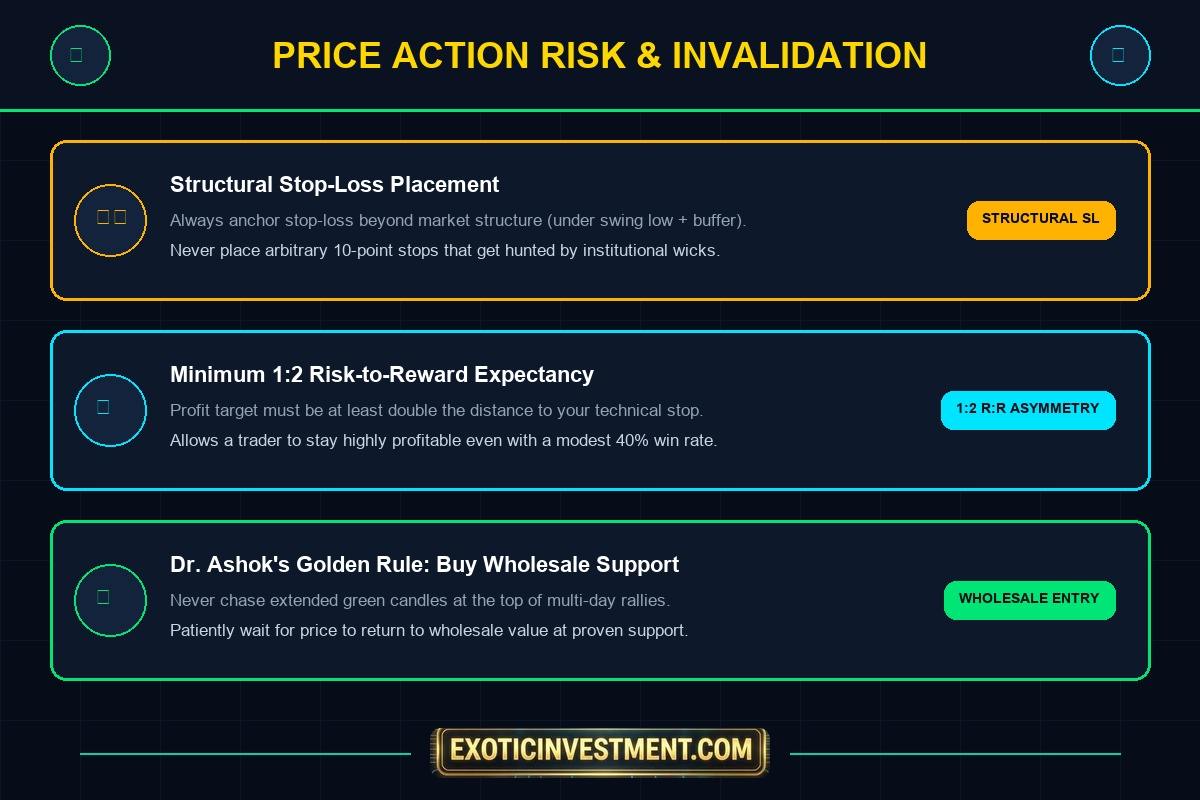
- Always Use Structural Stop-Losses: Never place your stop-loss at an arbitrary rupee number like “₹5 away.” Place your stop beyond the nearest market structure—just below the swing low of the breakout candle or the lower boundary of the support zone. If that level breaks, your trade hypothesis is mathematically invalidated.
- Demand a Minimum 1:2 Risk-to-Reward Ratio: If your structural stop-loss requires risking ₹20 per share, your profit target must be at least ₹40 per share at the next major overhead resistance zone. With a 1:2 ratio, you can be wrong on 50% of your trades and still generate healthy net profits over time.
- Scale Your Position to Risk 1% of Capital: Calculate your share quantity based on the distance to your stop-loss, never risking more than 1% to 1.5% of your total trading account on any single trade. If your account size is ₹5 Lakh, your maximum loss on a trade should never exceed ₹5,000.
- Practice Compounding Discipline: As our proverb reminds us: “ಹನಿ ಹನಿ ಕೂಡಿದರೆ ಹಳ್ಳ” (Hani hani koodidre halla — drop by drop makes a great stream). Steady, disciplined wins compound into significant fortunes. Practice “ನಿಧಾನವೇ ಪ್ರಧಾನ” (Nidhanave pradhana — patience is supreme).
For traders seeking comprehensive live chart mentorship, multi-timeframe top-down analysis, and institutional tape reading skills, explore our full curriculum at Exotic Investment Courses.
Frequently Asked Questions (FAQs)
1. What is price action trading in simple terms?
Price action trading is a technical analysis methodology where trading decisions are based entirely on historical price movements, naked candlestick formations, and horizontal key levels on a chart, without relying on lagging mathematical indicators like moving averages or RSI.
2. Which timeframe is best for price action trading in Indian stocks?
For swing traders holding stocks for several days to weeks, the Daily (1D) and 4-Hour (4H) timeframes provide the most reliable signals with minimal market noise. For active intraday traders in Nifty and Bank Nifty, combining the 15-Minute chart for structure with the 5-Minute chart for entry execution is the industry standard.
3. How do I distinguish between a genuine breakout and a false breakout?
A genuine breakout is accompanied by a decisive candle close beyond the key level and volume expansion at least 1.5 times the 20-day moving average volume. A false breakout typically shows a long rejection wick that closes back inside the range on weak, below-average volume.
4. Can beginners succeed using only price action?
Yes. Many institutional traders and market mentors consider price action the cleanest way to learn trading because it forces you to understand market psychology, supply and demand imbalances, and risk management directly rather than looking for magic indicator crossovers.
5. Why is the retest entry safer than buying the breakout immediately?
Buying the initial breakout exposes you to severe slippage and fakeouts. Waiting for price to retest the broken level confirms that previous resistance is holding as support, allowing you to place a much tighter stop-loss and dramatically improving your risk-to-reward ratio.
About the Author: Dr. Ashok Kumar N Rao
Dr. Ashok Kumar N Rao is a seasoned market mentor, SEBI-registered research analyst, and founder of Exotic Investment. With over two decades of experience analyzing Indian equity markets, derivatives architecture, and macroeconomic cycles, Dr. Ashok trains retail investors and institutional desks in risk-first portfolio construction and systematic market execution.
Disclaimer: Stock trading and price action analysis involve substantial risk of capital loss. Past technical setups do not guarantee future price action. All chart patterns and examples presented above are strictly for educational purposes. Consult a certified financial advisor before risking capital.
