
Every weekend, I sit down with traders and long-term investors at our trading desk who show me their equity portfolios with wide smiles. They tell me, “Doctor Saab, my small-cap fund gave me a 120% return!” But when I ask them how long they have held those units, they casually reply, “About seven or eight years.” That is the exact moment we need to pause, clear the board, and talk about mathematical reality. A 120% total gain across eight years is not the multi-bagger home run people imagine in their heads—it translates to an annualized compounding speed of roughly 10.36%. That barely beats a good fixed deposit after factoring in Indian retail inflation and capital gains taxes. If you want to build lasting wealth on Dalal Street, you must master how to calculate cagr in stock market investments instead of getting blinded by surface-level percentage noise.
In our Kannada culture, we often remind young learners: “ನೋಡಿ ತಿಳಿ ಮಾಡಿ ಕಲಿ” (Nodi thili, maadi kali — observe carefully first, understand the mechanism thoroughly, and only then put it into practice). Nowhere is this ancient wisdom more essential than in measuring your money’s real growth rate. When you blindly trust point-to-point absolute gains, you risk misjudging your risk, underestimating inflation, and holding underperforming assets for decades. Let us break down the exact mathematics, formula variations, and practical portfolio rules every Indian investor needs to evaluate compounding with razor-sharp precision.

Why Absolute Return Lies: CAGR vs Absolute vs XIRR
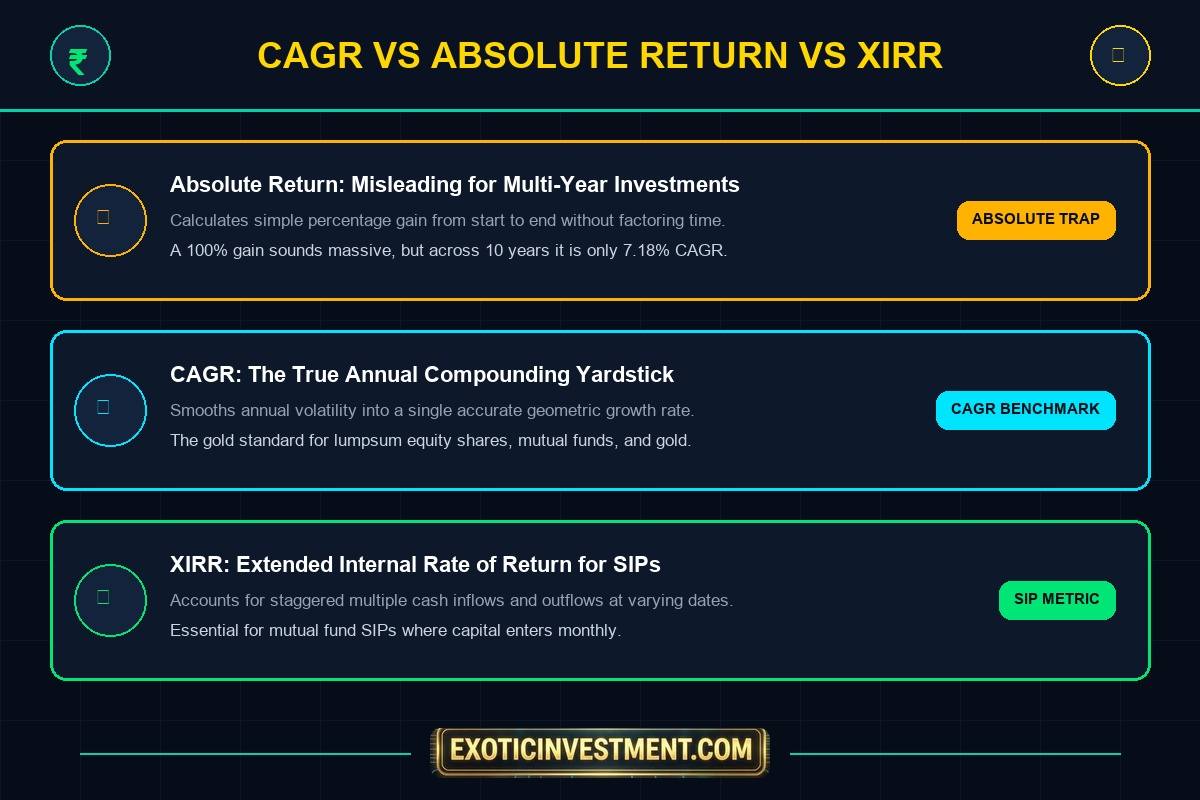
Before jumping into mathematical equations, let us clear up the three return yardsticks that confuse retail investors across India: Absolute Return, CAGR (Compounded Annual Growth Rate), and XIRR (Extended Internal Rate of Return). Each metric serves a specific purpose, but mixing them up leads to distorted financial decisions.
1. Absolute Return: The Raw Snapshot
Absolute return simply measures the total percentage increase between your buying price and selling price, completely ignoring the element of time. If you buy a stock at ₹100 and sell it at ₹200, your absolute return is 100%. If that double took place in 12 months, you are an extraordinary market participant. But if that exact same 100% gain took 12 years, your money compounded at a sluggish 5.95% per year—meaning you lagged behind safe government bonds while taking full equity volatility. Absolute return is only useful for trades held under one calendar year.
2. CAGR: The Geometric Compounding Benchmark
CAGR represents the constant annual rate at which your investment would have grown if it compounded smoothly each year from start to finish. Indian stock markets never move in a straight line; one year Nifty surges 28%, the next year it drops 14%, and the third year it chops sideways for months. CAGR cuts straight through that cyclical turbulence and provides a single, standardized annual percentage. It is the gold standard metric for evaluating lumpsum equity purchases, individual blue-chip stocks, real estate land holdings, and physical gold.
3. XIRR: The Moving Cashflow Metric
While CAGR assumes a single lumpsum deposit at the start and a single withdrawal at the end, modern Indian retail investors primarily invest through monthly SIPs (Systematic Investment Plans). Every monthly installment has a different holding period. Your first SIP installment may compound for 5 years, while your 60th installment compounds for only 30 days. To calculate the combined return of multiple staggered cashflows, we use XIRR. For portfolio tracking, calculating crypto positions, and checking multi-asset growth tables, investors rely on advanced tools at emintage.com to verify irregular cashflow compounding without manual spreadsheet errors.
The Mathematical CAGR Formula: Step-by-Step Breakdown
Now let us look at the actual mathematical engine behind CAGR. The formula looks slightly intimidating to non-mathematicians at first glance, but once you break it down into four simple arithmetic actions, you can calculate it on any smartphone calculator in 30 seconds.
CAGR = [ (Final Value / Beginning Value) ^ (1 / n) ] – 1
Where:
• Final Value (FV): The current valuation or selling price of your investment.
• Beginning Value (PV): The initial capital or purchase cost invested at the start.
• n: The total duration in years (can include fractions, e.g., 3.5 years for 42 months).
• ^ : Raised to the power of exponent.
Step-by-Step Practical Math Example
Suppose you invested ₹1,00,000 as a lumpsum in a Nifty 50 Index Fund on January 1, 2019. On January 1, 2024 (exactly 5 years later), your portfolio statement shows a total value of ₹2,10,000. Let us walk through the calculation step by step:
- Step 1: Divide the final value by the beginning value
₹2,10,000 / ₹1,00,000 = 2.10 (This means your capital multiplied by 2.10 times). - Step 2: Calculate the fractional exponent (1 / n)
Since the time horizon is 5 years, 1 / 5 = 0.20. - Step 3: Raise the growth factor to the power of 0.20
2.10 ^ 0.20 = 1.15998 (On any basic scientific calculator, type 2.10, press x^y or ^, and type 0.20). - Step 4: Subtract 1 and convert to percentage
1.15998 – 1 = 0.15998. Multiply by 100 to get 16.00% CAGR.
Your capital grew at an effective annual compounding rate of 16.00% every single year for five continuous years. Even though the market had wild intra-year swings during the 2020 crash, your true geometric progress was 16.00% per annum.

The Spreadsheet Shortcuts: Excel & Google Sheets
If you track your personal investments inside Microsoft Excel or Google Sheets, you do not need to punch exponents manually. You can use two straightforward formulas:
Simply format the resulting cell as a percentage with two decimal places, and your spreadsheet instantly displays the exact annualized return rate.
Real Indian Market Case Study: Nifty 50 & Blue-Chip Stocks
To truly appreciate CAGR, let us look at real historical numbers from the National Stock Exchange of India (NSE). Consider an investor who placed ₹10,00,000 into a Nifty 50 index basket in October 2009 when the index was hovering near 5,000 points. Fast forward fifteen years to October 2024, with Nifty trading around 24,800 points.
The index grew roughly 4.96 times in 15 years, giving an absolute return of approximately 396%. What was the actual CAGR?
CAGR = [ (24,800 / 5,000) ^ (1 / 15) ] – 1
CAGR = [ 4.96 ^ 0.0667 ] – 1 = 1.1124 – 1 = 11.24% CAGR (capital appreciation only)
When you include reinvested dividend yields of approximately 1.3% per annum, the total return index (Nifty 50 TRI) delivered roughly 12.54% CAGR over that 15-year stretch. That 12.54% annual compounding turned a ₹10 Lakh initial corpus into more than ₹59 Lakh. This proves another vital proverb we teach our students: “ಹನಿ ಹನಿ ಕೂಡಿದರೆ ಹಳ್ಳ” (Hani hani koodidre halla — drop by drop makes a great stream). Steady, disciplined annual compounding of 12% to 15% creates massive personal wealth over time without needing reckless speculative bets.

The Hidden Traps of CAGR: What the Formula Ignores
While CAGR is an indispensable benchmark, relying on it blindly without understanding its blind spots can be dangerous. An old Kannada proverb warns us: “ಮಾತು ಆಡಿದರೆ ಹೋಯ್ತು, ಮುತ್ತು ಒಡೆದರೆ ಹೋಯ್ತು” (Maathu aadidre hoythu, mutthu odedre hoythu). In life, once words are spoken, they cannot be taken back; once a precious pearl shatters, it cannot be mended. In financial markets, your hard-earned capital is just like that pearl. One careless, unhedged move or a flawed calculation can destroy years of accumulated compounding gains. Here are three critical limitations you must keep in mind:
1. It Hides Severe Downside Volatility
CAGR completely conceals the emotional rollercoaster of holding equities. An investment that delivers 15% CAGR over 3 years could have had returns of +80% in Year 1, -40% in Year 2, and +35% in Year 3. On paper, 15% looks calm and predictable. In real life, watching 40% of your net worth evaporate during Year 2 requires iron stomach discipline that most retail investors cannot tolerate without panicking at market bottoms.
2. It Cannot Handle Zero or Negative Base Values
If you start with an investment that goes to zero or becomes negative, the mathematical formula breaks down because you cannot divide by zero or compute roots of negative numbers. For distressed turnaround bets or micro-cap recovery plays, CAGR is mathematically invalid.
3. It Assumes Full Reinvestment
The mathematical equation assumes that every single rupee generated remains fully invested inside the asset compounding year-on-year. If you withdraw dividend payouts, spend cash bonuses, or trim positions to meet household expenses, your realized wealth will be substantially lower than the theoretical paper CAGR.
Dr. Ashok’s Portfolio Discipline: How to Use CAGR Like a Professional
When reviewing portfolios at our advisory desk, we apply three strict operational rules before drawing any conclusions from CAGR figures:
- Always Compare Against a Risk-Free Hurdle: If an active mutual fund manager or small-cap stock portfolio generates 11% CAGR over 5 years, they have essentially failed. You can earn 7% to 7.5% in risk-free sovereign bank deposits or RBI floating-rate bonds with zero drawdown risk. Taking equity volatility for a mere 3.5% risk premium is poor capital allocation. Demand at least a 5% to 7% alpha over the risk-free rate (target 13%+ CAGR) to justify equity exposure.
- Never Evaluate Equity on Less Than 3 to 5 Years: Measuring CAGR over 6 or 12 months is completely meaningless. In the short run, Dalal Street is driven by liquidity flows, FII positioning, and geopolitical headlines. Real business compounding takes 12 to 20 fiscal quarters to show up on balance sheets. Remember: “ನಿಧಾನವೇ ಪ್ರಧಾನ” (Nidhanave pradhana — patience is the supreme virtue in investing).
- Factor in Taxes and Inflation: If your portfolio delivers 14% nominal CAGR, subtract 6% Indian consumer inflation and roughly 1.5% for equity capital gains taxes (LTCG at 12.5%). Your real purchasing power growth is approximately 6.5% CAGR. Keep your eye focused firmly on real, post-tax compounding.
For investors wanting structured education on portfolio risk management, financial valuation models, and systematic trading execution, explore our comprehensive institutional modules and trading room access at Exotic Investment Courses.
Frequently Asked Questions (FAQs)
1. How do I calculate CAGR on a scientific calculator?
Divide your final portfolio value by your initial capital. Next, press the power button (marked as x^y or ^), enter brackets, type 1 divided by the number of years, close brackets, and hit equals. Finally, subtract 1 from the answer and multiply by 100 to display the annualized percentage rate.
2. Can I use CAGR to calculate returns on my monthly mutual fund SIP?
No. CAGR is strictly designed for single lumpsum investments where capital enters at point A and exits at point B. Because monthly SIPs involve multiple capital entries across different dates, using CAGR produces distorted figures. For mutual fund SIPs, always check the XIRR figure provided in your CAMS or KFintech consolidated statement.
3. What is considered a good CAGR in the Indian stock market?
Historically, broad market benchmarks like the Nifty 50 and BSE Sensex have generated between 12% and 14% CAGR over multi-decade periods. A well-managed active equity portfolio or diversified mutual fund basket that consistently delivers 14% to 16% CAGR over a 7-to-10-year cycle is considered top-tier performance on Dalal Street.
4. What is the key difference between CAGR and Average Annual Return?
Average Annual Return is an arithmetic mean that simply adds up annual returns and divides by the number of years, which drastically overstates growth. For example, if a stock rises 100% in Year 1 and falls 50% in Year 2, the arithmetic average is +25% [(100 – 50) / 2]. In reality, ₹100 grew to ₹200 and fell back to ₹100—producing a true CAGR of exactly 0%. CAGR reflects actual wealth compounded.
5. How does inflation impact my portfolio CAGR?
Inflation silently erodes purchasing power. If your equity investments generate a nominal CAGR of 13% while consumer inflation averages 6%, your real CAGR is roughly 7%. Always measure real net returns after accounting for both prevailing inflation rates and applicable capital gains taxes.
About the Author: Dr. Ashok Kumar N Rao
Dr. Ashok Kumar N Rao is a seasoned market mentor, SEBI-registered research analyst, and founder of Exotic Investment. With over two decades of experience analyzing Indian equity markets, derivatives architecture, and macroeconomic cycles, Dr. Ashok trains retail investors and institutional desks in risk-first portfolio construction and systematic market execution.
Disclaimer: Equity investments and derivatives trading are subject to market risks. All formulas, historical data, and case studies presented above are strictly for educational and analytical purposes. Past compounding performance does not guarantee future market returns. Consult a certified financial planner before deploying capital.
