
Learning how to calculate share average price is essential for every Dalal Street investor managing multiple buy orders across volatile market swings. When you purchase equities in multiple tranches at fluctuating price points, your true entry base is not a simple arithmetic average. Instead, understanding weighted average calculations prevents costly miscalculations, clarifies your actual break-even threshold, and sharpens capital allocation.
Listen, boss, retail traders often make the fatal mistake of adding purchase prices together and dividing by the number of transactions. For example, buying 10 shares at ₹500 and 90 shares at ₹300 does not produce an average buy price of ₹400. In reality, your true cost per share sits much lower at ₹320 because your second transaction carried nine times more capital weight.
Before risking hard-earned capital on volatile swings, reviewing equity fundamentals establishes rigorous analytical discipline. We explain these core valuation benchmarks in our foundational guide to basic stock market terms.
Here is the real deal: tracking your accurate average price allows you to set precise profit targets and defensive trailing stops. In addition, mastering this basic calculation gives you the confidence to manage long-term compounding portfolios through systematic dips. You can project your disciplined multi-year equity returns using our interactive sip calculator.
The Weighted Average Formula: How to Calculate Average Price per Share
The standard mathematical framework for finding your average buy price is straightforward and reliable. First, multiply the quantity of shares bought in each specific order by the corresponding purchase price to determine the cash outlay for that tranche. Second, sum the cash outlay across all executed tranches to find your total capital deployed.
Finally, divide your total capital deployed by the aggregate number of shares currently sitting in your Demat account. In mathematical notation, your Average Price per Share equals Total Investment Amount divided by Total Quantity of Shares. To track actual executed order details and trade settlement timelines, review our guide on delivery and CNC trading rules.
A time-tested Kannada proverb reminds us: “ಹನಿ ಹನಿ ಸೇರಿದರೆ ಹಳ್ಳ, ತೆನೆ ತೆನೆ ಸೇರಿದರೆ ಬಳ್ಳ” (Hani hani seridare halla, tene tene seridare balla — drop by drop makes a stream, grain by grain builds a harvest). Similarly, disciplined investors accumulate quality shares tranche by tranche, steadily shaping a formidable long-term wealth compounder. Therefore, calculating your weighted average accurately ensures you always trade with absolute mathematical clarity.

Illustration: 3 Quantitative Pillars Establishing Real-Time Weighted Average Share Price Calculations
Step-by-Step Practical Calculation Example for Indian Stocks
Let us walk through a realistic Dalal Street scenario to illustrate how to average shares across three distinct market phases. Suppose an investor spots a high-quality Nifty 50 banking leader and decides to build a position systematically over several months. Below are the three executed buy orders:
- Tranche 1 (Initial Breakout Buy): 50 shares purchased at ₹1,200 per share (Total Cost = ₹60,000).
- Tranche 2 (Correction Pullback Buy): 100 shares purchased at ₹1,050 per share (Total Cost = ₹1,05,000).
- Tranche 3 (Support Rebound Buy): 150 shares purchased at ₹950 per share (Total Cost = ₹1,42,500).
First, calculate total capital invested: ₹60,000 + ₹1,05,000 + ₹1,42,500 equals ₹3,07,500. Second, calculate total shares accumulated: 50 + 100 + 150 equals 300 shares. Consequently, dividing ₹3,07,500 by 300 reveals an average price per share of exactly ₹1,025.
In addition, factoring statutory exchange charges, STT, and stamp duty ensures your true break-even calculation is realistic. You can verify net trading profits after factoring statutory exchange fees with our free stock profit calculator.
| Purchase Tranche | Quantity (Shares) | Execution Price (₹) | Total Outlay (₹) | Weighted Cumulative Average |
|---|---|---|---|---|
| Tranche 1 (Initial Entry) | 50 | ₹1,200 | ₹60,000 | ₹1,200.00 |
| Tranche 2 (Dip Addition) | 100 | ₹1,050 | ₹1,05,000 | ₹1,100.00 |
| Tranche 3 (Support Rebound) | 150 | ₹950 | ₹1,42,500 | ₹1,025.00 |
| Portfolio Total | 300 Shares | — | ₹3,07,500 | Final Break-Even: ₹1,025.00 |
Notice how buying larger quantities at lower valuations pulled the average down much faster than simple arithmetic would suggest. In fact, if the market rebounds back to ₹1,150, this investor locks in a handsome profit of ₹37,500 despite their very first tranche sitting in the red. To calculate potential long-term compound growth rates on accumulated holdings, test our online cagr calculator.
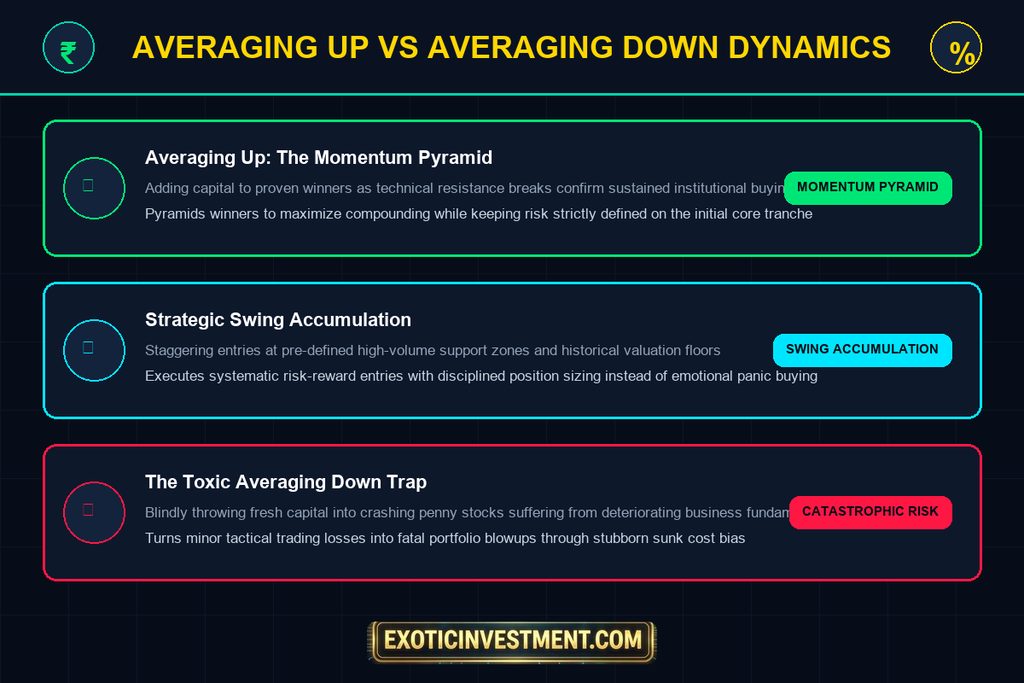
Illustration: Contrasting Systematic Momentum Pyramiding Against Dangerous Averaging Down Pitfalls
Averaging Up vs Averaging Down: Which Strategy Builds Greater Wealth?
Understanding when to average shares requires evaluating whether you are adding to winners or attempting to rescue losers. Professional traders predominantly practice averaging up, often described as pyramiding into winning positions. As a stock breaks out above multi-month resistance on heavy volume, adding capital confirms that institutional momentum is driving the trend.
Conversely, averaging down involves buying additional shares as the market price drops beneath your original purchase cost. While this lowers your break-even point, doing so indiscriminately in fundamentally weak companies is the single fastest way to blow up a trading account. To understand institutional accumulation signatures and market depth, study our detailed breakdown on the bazar chart.
Specifically, averaging down should strictly be reserved for businesses with zero balance sheet debt, consistent return on equity, and growing operating cash flows. In contrast, throwing good money after bad in debt-heavy penny stocks almost always ends in catastrophic losses. To analyze corporate debt levels and solvency metrics before allocating capital, review our guide on how to read a balance sheet.

Illustration: Essential Risk Management Safeguards and Capital Ceilings When Averaging Equity Positions
Essential Risk Management Rules When Averaging Stocks
Systematic share averaging requires ironclad risk boundaries to protect your overall investment capital. First, establish a strict 15% to 20% portfolio ceiling on any single stock position. No matter how attractive the valuation appears, never allow one averaged holding to dominate your entire net worth.
Second, implement a mandatory spacing filter between consecutive accumulation tranches. For instance, spacing entries at least 8% to 12% apart ensures you do not exhaust cash reserves during minor consolidation dips. You can size each entry tranche with mathematical precision using our dedicated position size calculator.
Third, always establish an ultimate invalidation price where the investment hypothesis is proven wrong. If corporate governance issues surface or quarterly revenue growth evaporates, exit the entire position without hesitation. To evaluate valuation multiples across peers before deploying capital, test our interactive pe ratio calculator.
Pro Tools, Technical Courses, and Books for Serious Investors
Mastering chart patterns and multi-tranche accumulation techniques requires structured education from experienced market veterans. For Kannada-speaking investors looking to spot high-probability swing breakouts, enroll in our practical Technical Analysis Course in Kannada. In addition, derivative traders can sharpen directional setups with our specialized Options Buying Course in Kannada.
Beginners taking their first steps on Dalal Street will gain tremendous practical clarity from our structured Basics of Stock Market Course. To access institutional-grade stock screeners, live chart setups, and proprietary valuation models year-round, subscribe to the MultiBagger Plus Courses & Pro Tools Annual Subscription.
You can also absorb Dr. Ashok Kumar N Rao’s bestselling insights in physical print through our popular books, Kaliyiri Share Market and Basics of Indian Stock Market Book. These resources equip retail participants with actionable frameworks tested over full market cycles.
In addition, global crypto market participants can examine quantitative models and algorithmic tracking tools at Emintage to diversify modern portfolios. Meanwhile, domestic equity investors can explore exchange circuit limits in our detailed guide on upper and lower circuit limits and analyze daily trend action on the day chart.
💡 Frequently Asked Questions About Share Average Price
Does Zerodha or Groww automatically calculate my average buy price?
Yes, leading Indian discount brokers automatically compute your weighted average purchase price and display it on your holdings dashboard. However, knowing the underlying math helps you plan upcoming buy limits and verify brokerage deductions using our zerodha brokerage calculator.
How do bonus shares or stock splits impact my average share price?
When a company issues bonus shares or executes a stock split, your total share count increases proportionally while your total invested capital remains identical. Consequently, your average price per share adjusts downward in exact proportion to the corporate action ratio, which you can track alongside face value of shares.
Is averaging down recommended for intraday trading?
No, averaging down in fast intraday trading is strictly dangerous because borrowed margin magnifies downside risk exponentially. Professional intraday scalpers cut losing trades quickly at pre-set stop losses instead of adding capital to underwater trades, as explained in our guide on stock broker apps.
How does dividend reinvestment change my average share price?
When cash dividends are reinvested into acquiring additional shares, the reinvested amount adds to your total capital base while the acquired shares increase your total volume. You can calculate historical dividend payouts and yield metrics across Indian blue-chips using our guide to dividend yield stocks in india.