
Understanding stock market wave theory explains why Indian share prices advance in rhythmic surges rather than clean straight lines. Most beginners chase green candles at exhausted cycle highs and freeze during healthy pullbacks. Today, pair disciplined wave counting with reliable stock market indicators to time Nifty and sector swings cleanly.
Ralph Nelson Elliott discovered this timeless human crowd psychology pattern back in the 1930s after studying decades of equity charts. Basically, collective fear and greed repeat identical fractal cycles across five-minute Bank Nifty candles and multi-year Nifty trends alike. Consequently, traders who map current wave position stop fighting institutional momentum blindly.
Let us keep Elliott Wave instruction clear, rule-based, and completely free of vague chart mysticism today. First, you will break down the classic five-wave impulse engine step by step. Second, we examine the three-wave ABC correction trap plus strict cardinal rules and a worked ₹3,00,000 Nifty swing example.
What Is Stock Market Wave Theory and Why Crowd Psychology Repeats?
Financial markets never rise purely on spreadsheet earnings ratios alone. Instead, human optimism and panic stretch asset valuations far beyond fair value before snapping back suddenly. Stock market wave theory captures that repeating emotional rhythm across clear directional impulses followed by orderly counter-trend corrections.
Specifically, every complete cycle contains eight distinct waves nested inside larger timeframes cleanly. Five numbered waves (1, 2, 3, 4, 5) push prices energetically along the dominant primary trend direction. Afterward, three lettered waves (A, B, C) pull prices backward to digest excess optimism before fresh accumulation restarts.
Notably, professional desks combine wave counts with classic chart patterns and heavy institutional volume spikes. Never force a wave count onto sluggish sideways smallcaps with thin daily liquidity. High-volume indices like Nifty 50 and banking leaders print noticeably cleaner fractal geometry.
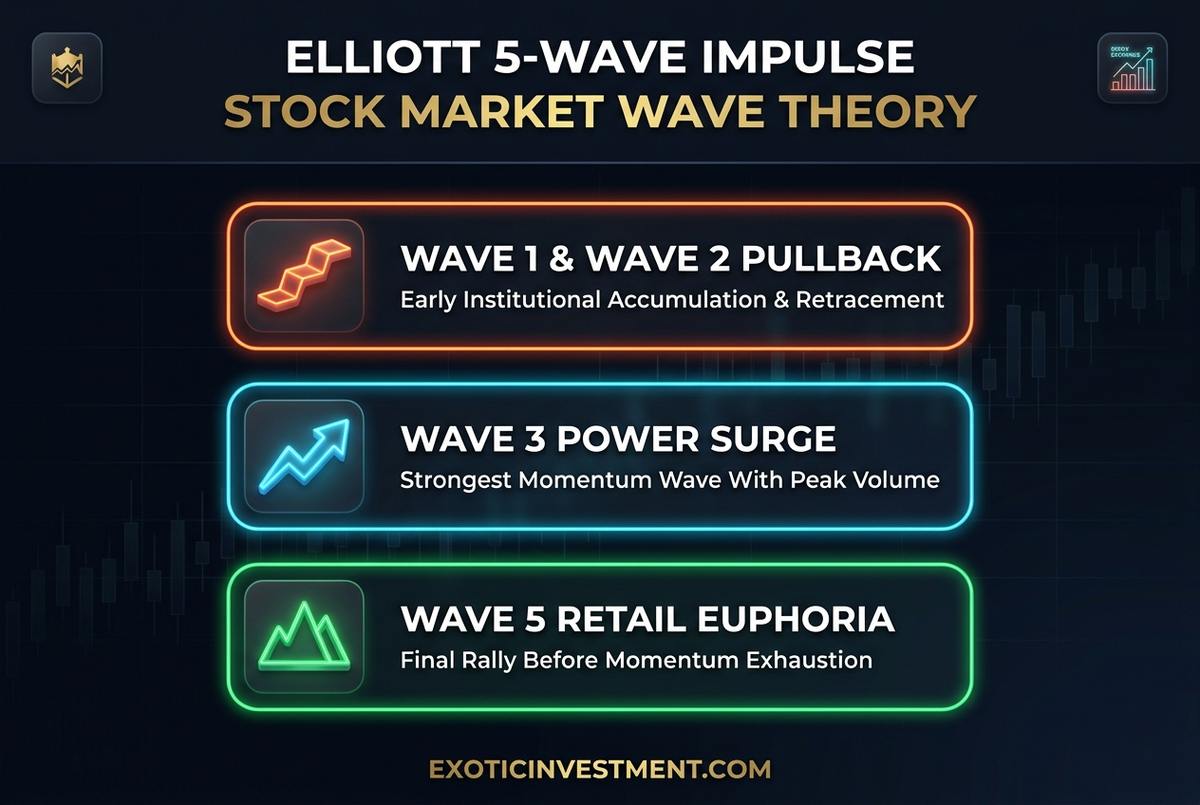
Illustration: Anatomy of the 5-wave Elliott impulse cycle showing accumulation, the powerful Wave 3 surge, and Wave 5 euphoria.
Breaking Down the 5-Wave Impulse Engine on Indian Charts
Every bull expansion leg moves through three advancing waves interrupted carefully by two short pullbacks. Clearly, spotting which numbered leg is currently unfolding keeps your risk-to-reward ratio sharply favorable.
Wave 1 and Wave 2: Smart Money Accumulation & Early Doubt
Wave 1 begins quietly right when gloomy headlines still scare most retail investors onto cash sidelines. First, sharp domestic and foreign desks accumulate undervalued cash leaders early, lifting price off depressed cyclical bottoms. Unfortunately, almost nobody recognizes Wave 1 as a fresh bull turn until weeks later.
Soon, skepticism triggers Wave 2 profit booking that erases 50% to 61.8% of the initial Wave 1 bounce. However, declining sell volume proves institutions rarely dump core positions during this healthy reset. Wait patiently beside key support and resistance levels for Wave 2 exhaustion candles.
Wave 3: The Institutional Power Surge
Wave 3 delivers the biggest, fastest, and cleanest profits in technical analysis history. Specifically, earnings upgrades appear suddenly, media coverage turns enthusiastic, and laggard short sellers cover positions frantically. Consequently, Wave 3 typically travels at least 1.618 times the net length of Wave 1.
Look closely at momentum panels during Wave 3 runs too. For instance, RSI and MACD reach multi-month peak highs alongside surging breakout volumes across relative strength outperformance scans. Thus, riding Wave 3 pullbacks offers far superior expectancy than catching falling knives during bear markets.
Wave 4 and Wave 5: Sector Rotation & Retail Euphoria
Following massive Wave 3 gains, institutional managers trim exposure gently and trigger a sideways or shallow Wave 4 pause. Typically, Wave 4 retraces just 23.6% to 38.2% of Wave 3 while alternating cleanly against Wave 2. Then Wave 5 carries prices to final marginal highs driven heavily by breathless social-media retail buying.
Watch carefully for hidden warning cracks during late Wave 5 surges! Even though benchmark price tags a fresh record peak, indicator breadth softens and MACD prints lower momentum peaks. Track weakening momentum setups carefully before aggressive trend exhaustion reverses fast.
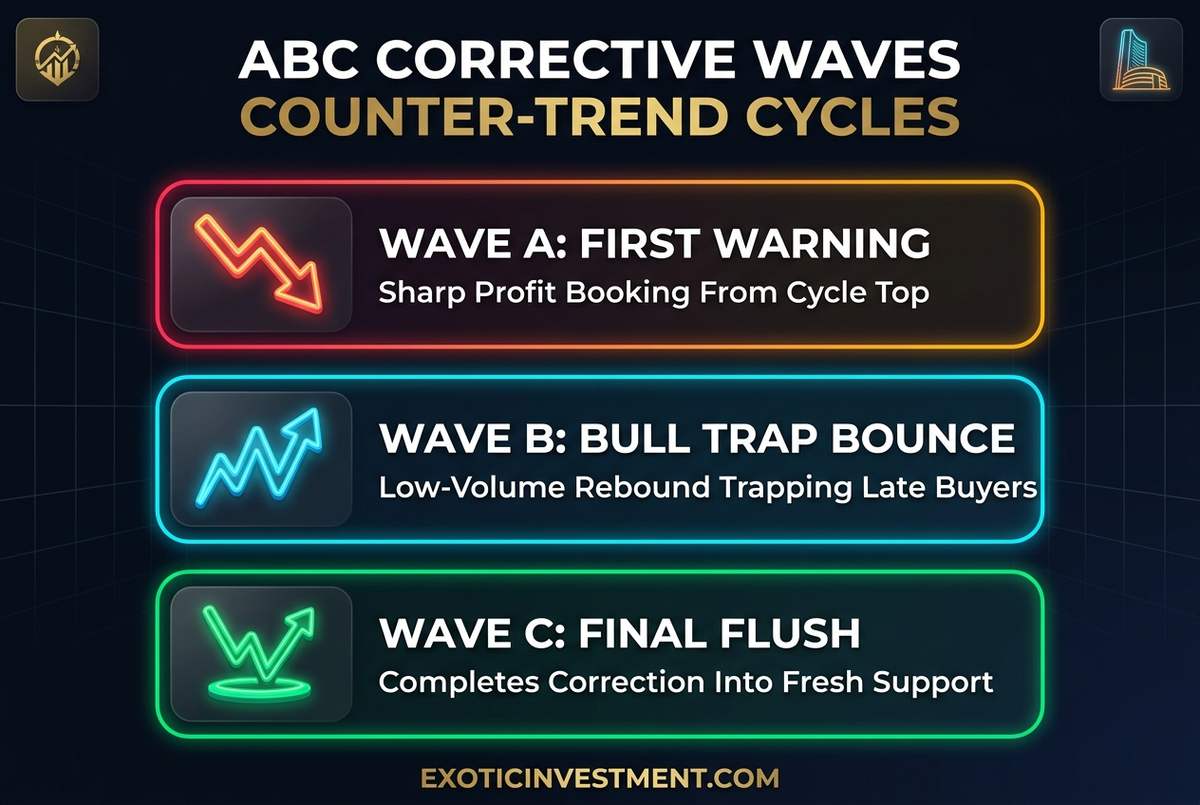
Illustration: Three-wave ABC corrective sequence exposing Wave B dead-cat bull traps and Wave C capitulation.
Decoding ABC Corrective Waves and Classic Bull Traps
Retail portfolios suffer heaviest drawdowns inside Wave B bounces because investors mistake temporary relief rallies for fresh bull cycles. Therefore, learning to recognize A, B, and C corrective behavior guards hard-earned gains fiercely.
First, Wave A strikes suddenly right off a euphoric Wave 5 high while financial news still sounds wildly optimistic. Most dip-buyers assume Wave A is merely another routine two-day bargain sale and add extra shares aggressively. In reality, rising distribution volume during Wave A reveals big funds locking in multi-month profits quietly.
Second, Wave B lures impatient bulls back with a treacherous lower-volume rebound toward previous breakdown levels. Because market breadth stays narrow during Wave B, seasoned desks lighten positions near key pivot resistance thresholds quickly. Third, Wave C drops decisively beneath Wave A lows, crushing late margin-heavy buyers until true seller exhaustion ends.
Elliott Impulse vs Corrective Waves & Fibonacci Ratios Table
Keep standard Fibonacci retracement and extension benchmarks handy beside every weekly Nifty or largecap index review. Notice clearly how each numbered or lettered leg behaves across volume, psychology, and typical target zones.
| Wave Label | Fibonacci Target Zone | Volume & Indicator Cue | Smart Trader Action |
|---|---|---|---|
| Wave 1 (Impulse) | Base rebound after accumulation | Quiet rising breadth off bottom | Prepare watchlist; avoid chasing |
| Wave 2 (Pullback) | 50%–61.8% retrace of Wave 1 | Light volume; RSI holds above 40 | Best low-risk Wave 3 entry zone |
| Wave 3 (Thrust) | 1.618x to 2.618x of Wave 1 | Explosive volume + peak MACD | Ride core trend with trailing stops |
| Wave 4 (Consolidation) | 23.6%–38.2% retrace of Wave 3 | Sideways flags; low volatility | Scale selective breakout adds cleanly |
| Wave 5 (Exhaustion) | Equal to Wave 1 or 61.8% W1–3 | Bearish RSI divergence + hype | Tighten stops; lock partial gains |
| Waves A-B-C (Correction) | Wave C = 1.0x–1.618x Wave A | Thin Wave B bounce; heavy C flush | Preserve cash until C completes |
Three Unbreakable Rules That Prevent Subjective Wave Guessing
Beginners often complain that five analysts label five totally different Elliott counts on the exact same chart. However, following three non-negotiable structural laws eliminates invalid guesses instantaneously every morning.
Law 1 — Wave 2 Never Retraces Over 100% of Wave 1: Specifically, if price drops even one tick beneath Wave 1’s start, your bullish count fails immediately. Therefore, place hard stop orders cleanly just below Wave 1’s origin trough.
Law 2 — Wave 3 Is Never the Shortest Impulse Wave: Among advancing Waves 1, 3, and 5, clearly Wave 3 cannot measure shorter than both neighbors. Normally it prints the longest expansion leg alongside our RSI trend confirmation readings cleanly.
Law 3 — Wave 4 Never Overlaps Wave 1 Price Territory: On standard daily cash equity charts, hence Wave 4 pullbacks must stay above Wave 1’s top peak. Notice how this rule locks clear invalidation levels beside trailing stop-loss triggers cleanly.
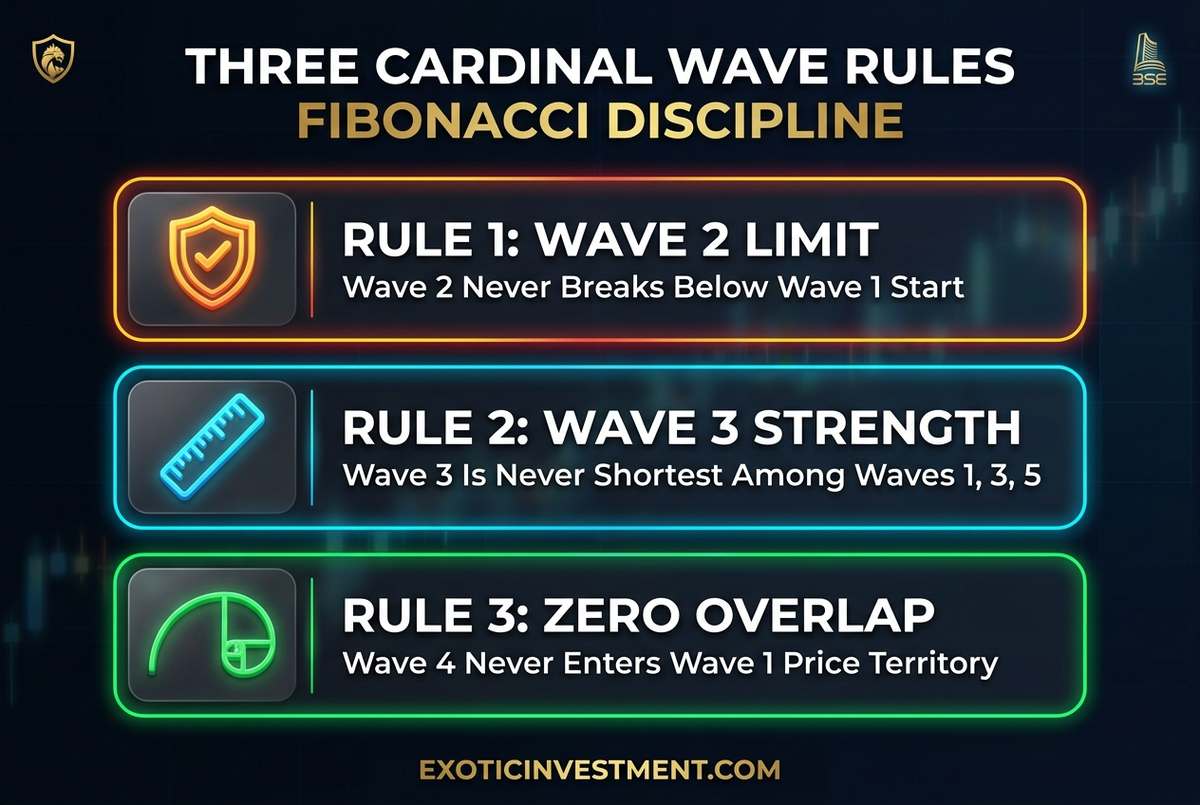
Illustration: Three mandatory Elliott Wave validation laws keeping entry invalidation objective and stops disciplined.
Worked ₹3,00,000 Nifty Swing Blueprint Using Fibonacci Wave Confluence
Let us map a realistic ₹3,00,000 capital swing plan using pure wave geometry without blind forecasts. Suppose a liquid Nifty largecap rallies in Wave 1 from ₹1,000 to ₹1,120 (a ₹120 opening move). Next, it drifts gently downward over two weeks on quiet volume toward ₹1,046 near its 61.8% Fibonacci retracement.
Because Law 1 keeps stop invalidation strictly below ₹1,000 (say ₹995), risk per share equals ₹51 cleanly. Limiting maximum portfolio loss strictly to 1% (₹3,000) via our position size calculator caps initial entry cleanly at 58 shares. Meanwhile, if Wave 3 expands 1.618 times Wave 1 (₹194 above ₹1,046), projected upside targets ₹1,240 cleanly—delivering nearly a 3.8-to-1 reward ratio!
Finally, never trade raw wave guesses in isolation from risk and tax math. Validate stop distances using our trading risk management calculator alongside daily candlestick confirmation bars and calculate net returns cleanly on our stock profit calculator.
🚀 Trade Clean Dalal Street Setups With Institutional Discipline
Stop guessing chart moves on Dalal Street. Learn structured market cycles alongside Dr. Ashok Kumar N Rao and our 1,300+ active trading community.
- Build strong equity foundations with our Kaliyiri Share Market Book and English bestseller Basics of Indian Stock Market Book.
- Access institutional screeners and pro research via the MultiBagger Plus Courses & Pro Tools Annual Subscription.
- Master price structure in our Technical Analysis Course in Kannada or index strategies in our Options Buying Course in Kannada.
💡 Frequently Asked Questions (FAQ): Stock Market Wave Theory
1. Does stock market wave theory work reliably on Indian Nifty and NSE stocks?
Yes, high-liquidity indices like Nifty 50, Bank Nifty, and top largecaps display crisp 5-wave impulses and ABC pullbacks regularly. Pair counts cleanly with core NSE stock indicators to filter noisy smallcaps effectively.
2. Which wave offers the safest and biggest profit opportunity?
Targeting Wave 3 right as Wave 2 ends near 50%–61.8% retracement delivers the strongest momentum alongside tight stop invalidation. Verify strong breakout volume cleanly with our momentum stock screener before entering positions.
3. What are the three mandatory rules of Elliott Wave counting?
Wave 2 cannot break below Wave 1’s start, Wave 3 cannot be shortest among Waves 1-3-5, and Wave 4 cannot enter Wave 1 price space. Enforce hard stops neatly via our trailing stop-loss guide whenever any law breaks.
4. How can beginners avoid getting trapped in a Wave B bounce?
Check whether rebound candles rise on shrinking participation and weak market breadth beneath overhead supply. Review daily resistance zone rejections before committing fresh swing cash into sudden relief rallies.
5. Which chart timeframe works best for beginners applying Wave Theory?
Daily and weekly candlesticks filter intraday noise cleanly and highlight unmistakable major Wave 3 extensions for swing traders. Inspect clean multi-session bars inside our day chart candlestick guide before zooming into hourly charts.
6. What happens if my primary Elliott Wave count proves wrong mid-trade?
Strict wave invalidation happens immediately at the exact tick where a cardinal rule breaks, protecting you before small errors swell into crashes. Control total capital risk cleanly using our position size calculator on every setup.