
Understanding exactly how is mutual fund return calculated is essential for every Indian investor managing systematic SIPs or lumpsum equity portfolios. When fund factsheets showcase attractive historical percentages, retail investors often assume those figures mirror their personalized portfolio experience. However, differing cash flow timelines, dividend choices, and expense ratios create noticeable variations between benchmark indices and actual investor returns.
Listen, boss, relying on a single return metric like point-to-point percentage gain is a major financial mistake. For example, doubling your money over two years yields an astounding return, whereas doubling your money over fifteen years represents mediocre single-digit compounding. In reality, choosing the correct mathematical formula separates informed wealth compounders from disappointed speculators.
Before committing capital to mutual fund schemes, establishing baseline financial literacy ensures your expectations remain grounded. We examine these fundamental market concepts in our beginner guide to basic stock market terms.
Here is the real deal: grasping the mathematical mechanics of Net Asset Value (NAV), CAGR, and XIRR empowers you to audit fund managers objectively. In addition, understanding these formulas helps you spot hidden fee drag caused by high expense ratios and intermediary commissions. You can model your disciplined future wealth milestones directly with our interactive sip calculator.
The Core Return Metrics: Absolute Return, CAGR, and XIRR Explained
Asset Management Companies in India report scheme performance using three primary mathematical frameworks depending on the holding horizon. First, Absolute Return measures simple point-to-point percentage gain: [(Current NAV – Initial NAV) / Initial NAV] × 100. Consequently, this metric is only meaningful for short horizons under 12 months because it completely ignores the compounding element of time.
Second, Compounded Annual Growth Rate (CAGR) smoothes multi-year performance into an equivalent annual rate: [(Current NAV / Initial NAV)^(1/n)] – 1. Therefore, CAGR is the universal gold standard for evaluating one-time lumpsum investments held undisturbed across 3, 5, or 10 years. To calculate long-term multi-year compound expansion across diversified portfolios, test our online cagr calculator.
Third, Extended Internal Rate of Return (XIRR) is mandatory whenever cash flows occur across multiple staggered dates, such as monthly SIPs. Because each SIP installment enters at a different market NAV, simple CAGR fails to reflect your actual portfolio yield. In contrast, XIRR calculates the exact annualized internal rate of return across all individual cash deposits and final redemptions.
A classic Kannada proverb wisely reminds us: “ಮಾತಿಗೆ ಮುತ್ತು, ಕೃತಿಗೆ ಚಿನ್ನ” (Matige mutthu, krutige chinna — spoken words are pearls, but disciplined action is gold). Similarly, moving beyond polished marketing brochures to calculate your actual XIRR reveals the true health of your financial plan. Hence, mastering these calculations ensures you allocate capital with absolute mathematical precision.
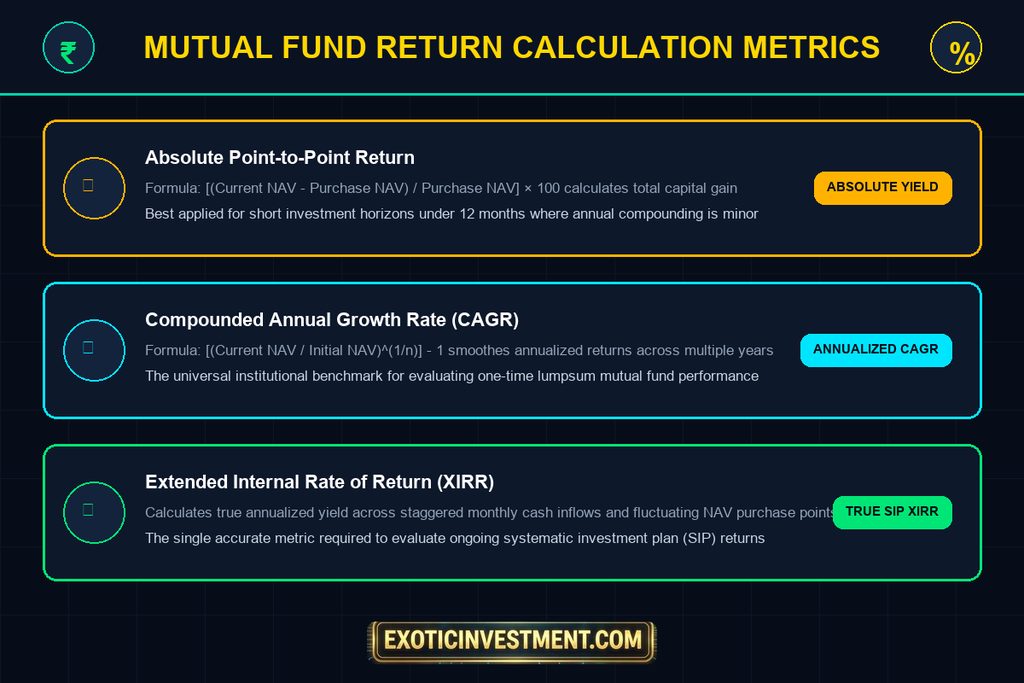
Illustration: 3 Quantitative Formulas Establishing Real-Time Mutual Fund Return Metrics
Net Asset Value (NAV) and What are Units in Mutual Funds
To understand how returns materialize, investors must first grasp how mutual fund units and NAV function in daily operations. When you invest capital into a mutual fund scheme, your money pools with contributions from thousands of other participants. In exchange, the fund house issues you a proportionate quantity of mutual fund units based on the applicable daily Net Asset Value.
Specifically, NAV represents the per-unit market value of the fund’s total underlying portfolio holdings. Fund accountants calculate NAV at the end of each trading session: (Total Portfolio Market Value + Cash – Accrued Liabilities & Expenses) divided by Total Issued Units. Consequently, as the underlying equity share prices rise on the NSE and BSE, the scheme NAV expands proportionally.
In addition, understanding units clarifies the power of rupee cost averaging across systematic investment cycles. When market corrections depress prices, your fixed monthly SIP amount purchases significantly more mutual fund units.
Subsequently, when Dalal Street rallies back into a bull market, those accumulated units create explosive portfolio wealth. To see how corporate share base structures compare, review our detailed guide on face value of shares.
| Return Calculation Method | Primary Mathematical Formula | Ideal Holding Scenario | Key Analytical Strength |
|---|---|---|---|
| Absolute Return | [(Ending NAV – Starting NAV) / Starting NAV] × 100 | Holding duration under 1 year | Simple point-to-point clarity |
| CAGR (Compounded Growth) | [(Ending NAV / Starting NAV)^(1/Years)] – 1 | Lumpsum holdings held 3+ years | Standardized annual comparison |
| XIRR (Internal Rate) | Net Present Value of all cash flows = 0 | Systematic SIPs & SWPs | Weights cash flow timing perfectly |
| Rolling Returns | Continuous daily overlapping CAGR blocks | Manager consistency audit | Eliminates point-to-point bias |
Notice how each calculation framework serves a distinct analytical purpose across different investment journeys. In addition, tracking your multi-tranche share purchases follows a similar quantitative logic. For investors building direct equity holdings, explore our practical guide on how to calculate share average price.

Illustration: The Complete Architecture of Daily Scheme NAV and Mutual Fund Unit Allocation
Direct vs Regular Plans: The Hidden Cost Dragging Down Your Compounding
One of the most significant factors reducing long-term mutual fund returns is the difference between direct plans and regular plans. In a regular plan, the fund house deducts distributor commissions directly from the scheme assets every single day. Consequently, regular plans carry an expense ratio approximately 0.5% to 1.0% higher than direct plans.
While a 1% annual fee difference may sound inconsequential initially, compound interest magnifies this fee drag dramatically over extended horizons. For instance, investing ₹10,000 monthly over 25 years in a direct plan yielding 13% generates over ₹2.26 Crore. In contrast, the same investment in a regular plan earning 12% produces approximately ₹1.89 Crore, resulting in a staggering loss of ₹37 Lakhs to distributor commissions.
Therefore, switching to direct mutual fund plans preserves your hard-earned wealth and boosts your realized XIRR without taking additional market risk. We conduct an exhaustive quantitative breakdown in our specialized guide on direct vs regular mutual funds. Protecting your capital against unnecessary fee leakage is the cornerstone of disciplined wealth creation.

Illustration: Aligning Return Metrics Across Lumpsum Allocations, Monthly SIPs, and Retirement SWPs
Practical Strategy: Lumpsum Deployment vs Systematic SIP Returns
Retail investors constantly debate whether deploying a one-time lumpsum or executing a staggered monthly SIP delivers superior net returns. If you invest a lumpsum at the bottom of a cyclical bear market, CAGR compounding accelerates dramatically. However, timing broad market bottoms consistently is virtually impossible for retail participants.
In contrast, a disciplined monthly SIP removes emotional timing anxiety and leverages rupee cost averaging across volatile swings. Additionally, upgrading to a step-up SIP allows you to increase contributions annually alongside salary increments, doubling your ultimate wealth corpus. To evaluate step-up compounding trajectories, review our dedicated analysis on step up sip vs regular sip.
Similarly, when transitioning into retirement or financial independence, implementing a Systematic Withdrawal Plan (SWP) ensures steady cash flow. Unlike fixed bank deposits, equity mutual fund SWPs offer superior tax efficiency because redemptions are treated as capital gains rather than regular income. We break down retirement cash flow mechanics in our detailed guide to swp in mutual funds.
Pro Tools, Technical Courses, and Books for Serious Investors
Mastering financial return metrics and active chart setups requires structured mentorship from seasoned market professionals. Kannada-speaking investors eager to master swing breakouts and momentum patterns can enroll in our hands-on Technical Analysis Course in Kannada. In addition, derivative traders can sharpen directional option strategies in our specialized Options Buying Course in Kannada.
Beginners taking their initial steps on Dalal Street will gain practical clarity from our structured Basics of Stock Market Course. To access institutional-grade stock screeners, live chart setups, and proprietary valuation models year-round, subscribe to the MultiBagger Plus Courses & Pro Tools Annual Subscription.
You can also absorb Dr. Ashok Kumar N Rao’s bestselling insights in physical print through our popular books, Kaliyiri Share Market and Basics of Indian Stock Market Book. These resources equip retail participants with actionable frameworks tested over full market cycles.
In addition, global crypto market participants can examine quantitative models and algorithmic tracking tools at Emintage to diversify modern portfolios. Meanwhile, equity traders can explore daily candlestick setups on the day chart and examine institutional market participation on the bazar chart.
💡 Frequently Asked Questions About Mutual Fund Return Calculations
Why is my SIP return different from the mutual fund’s published return?
Published fund returns represent standard point-to-point lumpsum CAGR across fixed calendar periods. In contrast, your personal SIP returns depend entirely on the specific dates and NAV prices at which your installments were executed, which you can verify using our sip calculator online.
How do dividend reinvestments affect mutual fund NAV and returns?
In growth plans, dividends are retained within the scheme, increasing the NAV continuously over time. In contrast, dividend payout options reduce the scheme NAV by the exact dividend value distributed, which you can study in our guide to dividend yield stocks in india.
What is a good XIRR for equity mutual funds in India?
Over a full 7 to 10 year market cycle, an annualized XIRR between 12% and 15% represents outstanding long-term equity performance that comfortably outpaces inflation. You can compare long-term compound growth trajectories across asset classes with our online compound interest calculator.
How are mutual fund capital gains taxed after recent budget updates?
Equity mutual fund units held over 12 months are classified as long-term capital gains and taxed at 12.5% for gains exceeding ₹1.25 Lakh per financial year. Conversely, short-term equity gains held under 12 months are taxed at 20%, as detailed in our guide on stock broker apps.