
Understanding what sum invested for 2 years at 12 percent compound interest delivers is the foundational gateway to long-term wealth creation. Whether you are solving practical financial math problems or modeling real-world portfolio growth, compound interest generates exponential capital expansion. In fact, recognizing how annual compounding multiplies original principal shields investors from dangerous inflation erosion.
Listen, boss, many investors confuse basic simple interest with exponential compounding. Under simple interest rules, a 12% annual rate yields exactly 24% over two full years. In reality, annual compounding generates 25.44% because interest earned during the first year begins working to earn fresh interest during the second year.
Before allocating capital into market assets, developing quantitative discipline ensures your financial expectations match reality. We break down these fundamental trading and valuation principles in our beginner guide to basic stock market terms.
Here is the real deal: grasping this simple compounding math allows you to plan realistic retirement corpuses and child education funds. In addition, knowing how to reverse-engineer required principal helps you establish precise monthly savings targets. You can simulate multi-year compounding trajectories directly with our interactive compound interest calculator.
The Mathematical Framework: Solving the 2-Year 12% Compounding Equation
The standard future value formula provides the exact mathematical foundation for all compound interest calculations. Specifically, the total accumulated amount equals principal multiplied by the quantity one plus the interest rate raised to the power of time. In mathematical terms, this equation is expressed as Amount = Principal × (1 + r)^t.
When the annual interest rate is 12%, the term (1 + r) becomes 1.12. Consequently, squaring 1.12 for a two-year holding duration yields exactly 1.2544. Therefore, any principal sum invested for two years at 12% annual compounding expands by exactly 25.44%.
A classic Kannada proverb wisely teaches us: “ಗಿಡವಾಗಿ ಬಗ್ಗದ್ದು ಮರವಾಗಿ ಬಗ್ಗೀತೆ?” (Gidavagi baggaddu maravagi baggeethe? — what does not bend as a sapling, will it bend as a full-grown tree?). Similarly, starting your compounding journey early allows small capital saplings to branch into mighty financial fortresses.
In addition, delaying your investment horizon by even three years severely curtails late-stage exponential growth. Hence, understanding this basic multiplier empowers you to deploy funds with absolute conviction and discipline.

Illustration: 3 Core Quantitative Drivers Governing Compound Interest and Principal Formulations
Finding the Principal: How to Reverse-Calculate What Sum of Money at Compound Interest Will Grow
Frequently, financial exams and real-world planning ask the inverse question: what sum of money at compound interest will yield a specific future target? To find the required starting principal, you simply divide the target future amount by the compounding multiplier 1.2544. For instance, if you require a target amount of ₹10,00,000 in two years, dividing ₹10,00,000 by 1.2544 reveals a required starting sum of ₹7,97,194.
In addition, this reverse math is indispensable when preparing for significant milestones like a home down payment or higher education fees. Below is a practical reference table illustrating how various starting sums expand over two years at 12% annual compounding on Dalal Street. Reviewing these figures helps you select an optimal monthly savings allocation.
| Invested Principal Sum (₹) | Year 1 Value at 12% (₹) | Year 2 Final Amount (₹) | Total Interest Earned (₹) | Compounding Gain |
|---|---|---|---|---|
| ₹50,000 | ₹56,000 | ₹62,720 | ₹12,720 | +25.44% |
| ₹1,00,000 | ₹1,12,000 | ₹1,25,440 | ₹25,440 | +25.44% |
| ₹2,50,000 | ₹2,80,000 | ₹3,13,600 | ₹63,600 | +25.44% |
| ₹5,00,000 | ₹5,60,000 | ₹6,27,200 | ₹1,27,200 | +25.44% |
| ₹10,00,000 | ₹11,20,000 | ₹12,54,400 | ₹2,54,400 | +25.44% |
In addition, comparing these figures against equity index performance provides invaluable perspective. Historically, broad Indian market benchmarks like the Nifty 50 have delivered long-term returns hovering around 12% to 14% annualized CAGR. To calculate how much wealth your systematic equity SIP will build across 5, 10, or 20 years, use our free sip return calculator.
Similarly, calculating the average purchase cost of multiple accumulated share lots ensures your portfolio records remain crystal clear. For investors seeking exact entry tracking, explore our guide on how to calculate share average price. This cross-disciplinary calculation framework guarantees solid portfolio oversight.
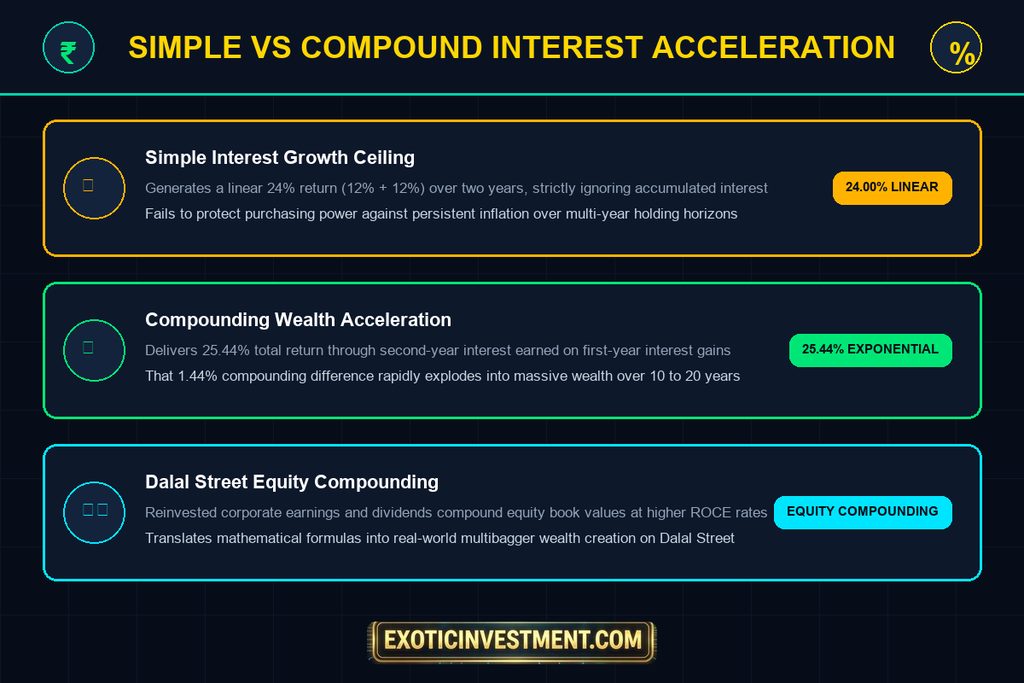
Illustration: Contrasting Linear Simple Interest Caps Against Exponential Compounding Wealth Growth
Simple vs Compound Interest: Why the Compounding Difference Explodes Over Time
During the initial two years, the gap between simple interest and compound interest appears modest at exactly 1.44%. However, as your investment horizon expands beyond 5, 10, or 20 years, this subtle divergence expands into a massive chasm. For example, over a 20-year span at 12%, simple interest delivers a 240% gain while annual compounding expands capital by over 864%.
Specifically, compound interest generates what legendary market veterans describe as the classic hockey-stick growth curve. In the initial years, your capital base does the heavy lifting through principal contributions. In contrast, during the second decade, previously accumulated gains generate significantly more money each year than your initial salary savings.
To analyze the exact growth rates implied by current stock market valuations, explore our interactive reverse cagr calculator. In addition, studying corporate debt management and interest coverage metrics helps you identify sound balance sheets. We break down these solvency filters in our detailed guide on how to read a balance sheet.
Consequently, holding fundamentally resilient leaders during volatile market cycles allows uninterrupted internal reinvestment. You can verify how broad market sentiment and volume accumulation behave through our practical guide to the bazar chart. Mastering both corporate health and chart structure completes your strategic framework.

Illustration: The 3 Core Lifecycle Phases of Long-Term Investment Compounding Horizons
How Stock Market Leaders Harness Compounding to Create Multibaggers
Translating theoretical compounding math into Dalal Street success requires identifying businesses that compound retained earnings internally. High-quality Indian companies with Return on Capital Employed (ROCE) exceeding 20% reinvest profits back into productive business expansion. Consequently, this corporate reinvestment cycle compounds shareholder book value at rates far exceeding standard debt instruments.
First, disciplined investors accumulate these compounding titans during broad market corrections rather than chasing speculative hype. Second, tracking corporate actions like bonus shares and splits ensures your share count expands alongside business growth. You can examine how corporate capitalization works in our guide to face value of shares.
Third, holding dividend-paying champions allows you to reinvest payouts into acquiring additional shares at lower prices. In fact, dividend reinvestment acts as a powerful compounding accelerator during multi-month consolidations. You can evaluate top dividend performers in our curated guide on dividend yield stocks in india.
In addition, tracking position sizing and risk limits safeguards your principal against sudden market drawdowns. You can calculate precise trade capital limits using our interactive position size calculator. Balancing offensive compounding growth with defensive position sizing builds enduring generational wealth.
Pro Tools, Technical Courses, and Books for Serious Wealth Creators
Mastering financial math and technical setups requires guided mentorship from experienced market veterans. Kannada-speaking traders seeking high-probability swing trading setups can enroll in our hands-on Technical Analysis Course in Kannada. In addition, derivative enthusiasts can master directional strategies through our specialized Options Buying Course in Kannada.
Beginners taking their initial steps on Dalal Street will find practical guidance in our structured Basics of Stock Market Course. To access institutional-grade stock screeners, compounding calculators, and live market trade setups, subscribe to the MultiBagger Plus Courses & Pro Tools Annual Subscription.
You can also absorb Dr. Ashok Kumar N Rao’s bestselling investment wisdom in print through our acclaimed books, Kaliyiri Share Market and Basics of Indian Stock Market Book. These resources equip retail investors with battle-tested frameworks proven across multiple market cycles.
In addition, global crypto market participants can examine quantitative models and algorithmic tracking tools at Emintage to diversify modern portfolios. Meanwhile, equity traders can explore delivery execution mechanics in our dedicated guide on delivery and CNC trading rules and analyze price action on the day chart.
💡 Frequently Asked Questions About 2-Year 12% Compounding
How much interest does ₹1 Lakh earn in 2 years at 12% compounded annually?
An investment of ₹1 Lakh earns exactly ₹25,440 in total interest over two years, growing to a final amount of ₹1,25,440. You can model additional compounding periods with our online compound interest calculator.
What is the difference between annual and half-yearly compounding at 12%?
Half-yearly compounding divides the annual rate by two (6% every 6 months) and compounds across four periods, yielding a higher multiplier of 1.2625. Consequently, ₹1 Lakh grows to ₹1,26,248 under semi-annual compounding, providing an extra ₹808 return, which you can verify with our cagr calculator.
How do taxes impact my 12% compound returns in India?
In India, debt instrument interest is taxed at individual slab rates, which dampens net compounding velocity. In contrast, equity investments held over 12 months benefit from concessional long-term capital gains tax rates under SEBI guidelines, as detailed in our guide on stock broker apps.
Can a monthly SIP match a 12% lump sum compounding return?
A monthly SIP deploys capital gradually across market dips, reducing sequence-of-returns risk and smoothing volatility. While a lump sum deployed at a market bottom compounds faster, a disciplined SIP builds massive wealth without timing anxiety, as shown in our step up sip vs regular sip analysis.