
Listen, boss, if there is one corporate house in India where three generations of investors built life-changing wealth, it is the house of Tatas. But finding the best tata shares to buy for long term wealth creation in 2026 requires looking beyond legacy giants. Mature mega-caps like TCS and Tata Motors have already seen their big valuation re-rating phases. The real wealth compounding over the next decade lies in high-growth Tata powerhouses. Whether you track live LTP, CMP, and ATP stock price terms or build a multi-year portfolio, let’s keep it simple. Here is the complete guide to the 5 best Tata stocks, combining fundamental moats with technical chart analysis.
Why Invest in Tata Group Stocks for Generational Wealth?
Here is the real deal about the Tata Group. The Tata brand represents trust and clean corporate governance. When you buy a Tata stock, you partner with a promoter group that reinvests cash into future-ready industries. These include electric vehicles, green energy, fast fashion, and engineering design.
However, blindly buying every Tata stock is a mistake. Mature companies face growth plateaus. Cyclical commodity businesses suffer sharp earnings swings. To generate high returns, you must focus on companies with high return on capital employed (ROCE > 20%), pricing power, and bullish weekly chart patterns. Before placing equity delivery orders, read our complete guide on delivery shares and CNC order execution to manage settlement cycles.
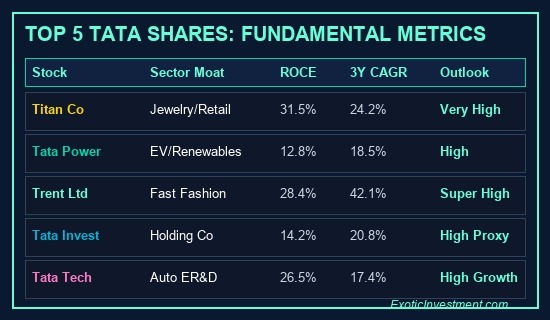
Illustration: Top 5 Tata Shares: Fundamental Scorecard & Key Valuation Metrics
1. Titan Company Ltd (TITAN) — The Crown Jewel & Retail Leader
If there is one anchor compounder in the entire Tata conglomerate, it is Titan Company. What started as a simple watchmaker is now India’s leader in luxury lifestyle, jewelry (Tanishq, Zoya, Mia, CaratLane), and eyewear.
Fundamental Analysis & Moat:
First, Titan commands a massive competitive moat in organized jewelry through Tanishq. Over 65% of India’s jewelry market remains unorganized. This gives Tanishq huge runway for market share gains as buyers shift to hallmarked gold.
Second, Titan delivers an industry-leading ROCE of over 31% with strong operating cash flows. The full buyout of CaratLane strengthens Titan’s grip on younger, digital jewelry buyers. In addition, store expansion in the GCC region and the US opens fresh foreign revenue streams.
Check the stock’s valuation multiple using our free PE Ratio Calculator before investing large sums.
Core Technical Chart Analysis:
From a technical standpoint, Titan is a textbook ascending trendline compounder on weekly charts. The stock consistently respects its 200-day Exponential Moving Average (200 EMA) during market dips.
In our private WhatsApp community of 1,300+ traders, we track Titan’s multi-month base formation. The stock has established solid demand support in the ₹3,200 – ₹3,350 accumulation zone. When weekly RSI cools down to the 40–48 band, it offers a high-probability entry window. A sustained breakout above its all-time high resistance pivot opens the pathway toward ₹4,200 and ₹4,800 over the next 24 to 36 months.
2. Tata Power Company Ltd (TATAPOWER) — The Green Energy Pioneer
Tata Power is not just a legacy utility company anymore. It has transformed into India’s leading integrated green energy player, leading the nation’s transition toward solar, wind, and EV charging networks.
Fundamental Analysis & Moat:
First, Tata Power targets expanding its clean energy capacity to 20 GW by 2030. This clean capacity will account for over 70% of its total generation mix.
Second, the company dominates India’s EV charging ecosystem with thousands of public, home, and fleet charging points nationwide. Also, the surge in solar rooftop installations creates strong cash flow visibility for its solar EPC division.
If you use margin facilities for accumulation, understand how the margin trading facility (MTF) works when managing borrowed capital during pullbacks.
Core Technical Chart Analysis:
On daily and weekly charts, Tata Power exhibits a powerful symmetrical triangle consolidation. Volume profile analysis shows institutional accumulation taking place between ₹390 and ₹410, creating a firm price floor.
The 50-day EMA continues to act as dynamic support on daily pullbacks. A decisive weekly close above the ₹460 resistance hurdle with high volume will trigger a major technical expansion phase, targeting ₹550 and ₹640 over the long term.
3. Trent Ltd (TRENT) — The Fast-Fashion Multibagger Machine
Trent Ltd is arguably the most explosive growth engine in the retail sector today. Driven by the phenomenal success of Zudio and Westside, Trent has delivered massive alpha for growth-focused investors.
Fundamental Analysis & Moat:
First, Zudio’s value fashion model runs on a fast 15-day design-to-shelf supply chain, generating rapid inventory turns and zero dead stock. This enables Trent to compound revenues at an astonishing 40%+ CAGR.
Second, Trent’s joint venture with Tesco (Star Bazaar) and emerging beauty brands (Misbu, Samoh) provide new growth drivers. The company maintains zero net debt while opening 200+ new Zudio stores every year.
To project what this business compounding builds over 5 to 10 years, use our free Reverse CAGR Calculator and compare lumpsum gains with our Lumpsum Investment Calculator.
Core Technical Chart Analysis:
Trent has been one of the strongest trend-following leaders on the NSE. The stock trades comfortably above all key moving averages (20, 50, and 200 EMA) on the weekly chart.
Because Trent trades at premium momentum multiples, our technical strategy focuses on buying pullbacks to the daily 50 EMA. The ₹6,200 – ₹6,500 zone represents a high-volume support shelf. For swing traders and long-term investors, trailing stop-losses below swing lows protects profits while targeting ₹8,500+.
4. Tata Investment Corporation Ltd (TATAINVEST) — The Value Holding Proxy
If you want diversified exposure to both listed and unlisted Tata Group powerhouses, Tata Investment Corporation is the ultimate vehicle. It operates as an investment company, holding significant equity stakes across the Tata empire.
Fundamental Analysis & Moat:
First, Tata Investment owns valuable stakes in Tata Sons, Tata Capital, Tata Motors, Trent, Titan, and Tata Chemicals. As unlisted Tata enterprises tap into value through public listings, Tata Investment’s Net Asset Value (NAV) expands exponentially.
Second, the company is completely debt-free with zero operational overheads. It acts as a pure holding company dividend compounder, passing on regular dividend payouts and capital appreciation to shareholders.
Check your exact position sizing before adding holding companies with our Position Size Calculator.
Core Technical Chart Analysis:
Tata Investment is known for sharp technical base-breakout rallies followed by consolidation phases. On the daily chart, the stock recently completed a high-volume base retest near the ₹6,400 – ₹6,700 horizontal demand zone.
Delivery volume percentages regularly exceed 70% during breakout candles, indicating smart-money accumulation. Technical support sits firmly at the 200-day EMA near ₹6,200. Long-term technical projections point toward ₹8,200 and ₹9,500 as upcoming multi-year extension targets.
5. Tata Technologies Ltd (TATATECH) — The EV & Digital Engineering Leader
Tata Technologies is a global engineering services company specializing in product development and digital enterprise solutions for automotive, aerospace, and heavy machinery industries.
Fundamental Analysis & Moat:
First, Tata Technologies is a prime beneficiary of the global shift toward Electric Vehicles (EVs) and software-defined vehicles. Its engineering partnerships with global OEMs (including JLR, BMW, and VinFast) provide long-term contract visibility.
Second, the company operates with an asset-light model, zero debt, and an impressive ROCE exceeding 26%. Its expansion into aerospace engineering provides healthy revenue diversification beyond automotive clients.
Also, when stocks trade near critical price bands, check our guide on circuit limits and trading halts to manage volatility.
Core Technical Chart Analysis:
Following its landmark IPO, Tata Technologies spent multiple months carving out a classic rounding bottom accumulation base on daily charts. Price action shows a clean breakout above the ₹980 – ₹1,020 resistance barrier with bullish RSI divergence.
The daily 200 EMA is flattening and turning upward, signaling a primary trend reversal from consolidation to markup. Key accumulation sits between ₹920 and ₹960, with long-term chart targets placed at ₹1,250 and ₹1,480.
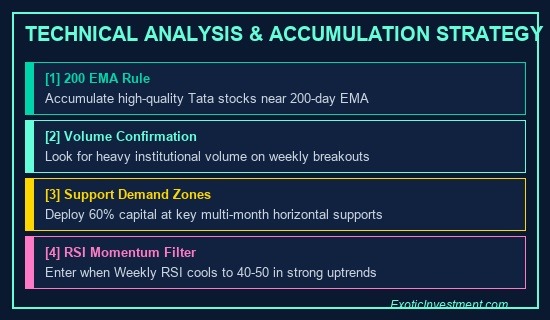
Illustration: Technical Chart Strategy: 200 EMA Rule, RSI Filter & Accumulation Zones
Technical Analysis Accumulation Strategy for Tata Shares
Knowing which stocks to buy is only half the battle. Timing your entries using technical analysis ensures you avoid buying at the top of emotional rallies. Here are the core technical rules our 1,300+ community members follow:
1. The 200 EMA Golden Accumulation Rule: Never chase large-cap Tata stocks when prices are extended 25%+ above their 200-day EMA. Instead, wait patiently for price pullbacks toward the 50 EMA or 200 EMA on daily/weekly charts to deploy capital.
2. Weekly RSI Momentum Filter: For long-term investors, the ideal time to add shares is when the Weekly Relative Strength Index (RSI) cools down to the 40–50 range during market corrections. Avoid buying when Weekly RSI exceeds 75 (overbought zone).
3. Multi-Timeframe Volume Confirmation: Ensure that weekly breakout candles are backed by above-average institutional volume. Heavy volume on green candles combined with drying volume on red pullbacks confirms smart-money accumulation.
To master advanced chart patterns and candlestick setups, enroll in our Technical Analysis Course in Kannada or explore foundational concepts in our Basics of Stock Market Course. If you trade derivatives, explore our Options Buying Course in Kannada.
How to Build Your Tata Stocks Long-Term Portfolio (Allocation Map)
To maximize compounding while managing sector concentration risk, here is our recommended portfolio allocation framework for the 5 best Tata shares:
- Titan Company (30% Allocation): Large-cap core anchor providing high-ROCE compounding and retail consumption growth.
- Trent Ltd (25% Allocation): High-alpha fast-fashion powerhouse driving aggressive portfolio capital appreciation.
- Tata Power (20% Allocation): Multi-year infrastructure proxy capturing India’s green energy and EV transition.
- Tata Investment Corporation (15% Allocation): Diversified Tata Sons and unlisted subsidiary holding value shield.
- Tata Technologies (10% Allocation): High-growth automotive ER&D engineering and software-defined vehicle specialist.
Calculate your long-term monthly compounding roadmap using our free SIP Return Calculator. Investors seeking curated high-growth stock picks can also join our premium multibagger stock picks subscription for weekly research updates.
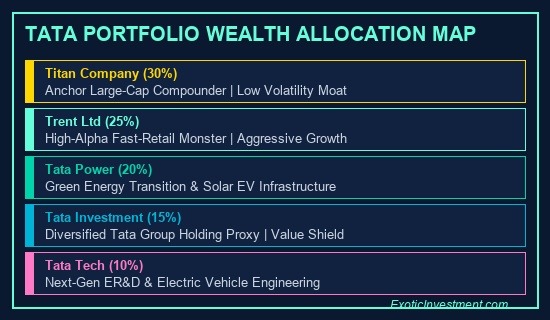
Illustration: Tata Shares Portfolio Allocation Map & Long-Term Compounding Framework
Taxation & Brokerage Costs on Long-Term Tata Shares
When investing in Tata shares for multi-year wealth creation, tracking statutory taxes and brokerage charges is essential for accurate net return calculations:
First, under current tax rules, Long-Term Capital Gains (LTCG) on equity shares held for more than 12 months are taxed at 12.5% on profits exceeding the ₹1.25 Lakh annual exemption limit.
Second, Short-Term Capital Gains (STCG) on shares held for less than 12 months are taxed at 20% plus applicable cess.
Calculate your exact post-tax net profit using our free Stock Market Tax Calculator and check broker transaction charges with our Zerodha Brokerage Calculator.
Kannada readers can also grab Ashok Kumar N Rao’s bestselling Kaliyiri Share Market Book, or explore the English edition on the Basics of Indian Stock Market Book page. For external financial tools, check out Emintage financial calculators for additional research.
Frequently Asked Questions — Best Tata Shares to Buy for Long Term
FAQ 1: Which are the 5 best Tata shares to buy for long term wealth creation in 2026?
The 5 best Tata shares for long-term compounding in 2026 are Titan Company, Trent Ltd, Tata Power, Tata Investment Corporation, and Tata Technologies. These companies offer superior ROCE, industry leadership, and structural growth runways. Project your 10-year compounding target with our Reverse CAGR Calculator.
FAQ 2: Why are TCS and Tata Motors not included in this top 5 list?
TCS is a mature IT giant with single-digit growth expectations, while Tata Motors is highly cyclical. We replaced them with Tata Investment Corporation and Tata Technologies to capture higher alpha from unlisted Tata value tapping into and EV engineering. Evaluate valuation multiples with our PE Ratio Calculator.
FAQ 3: How should investors technically time their entries in Titan and Trent?
Never chase extended rallies. Accumulate Titan near its 200-day EMA or key horizontal demand zones (₹3,200 – ₹3,350), and buy Trent on pullbacks to the daily 50 EMA when weekly RSI cools to 45–50. Learn multi-timeframe charting in our Technical Analysis Course in Kannada.
FAQ 4: How much wealth can a 5-stock Tata portfolio create over 10 to 15 years?
Historically, a focused basket of top-tier Tata companies has compounded at an average CAGR of 18% to 24%. At a 20% CAGR, an initial investment of ₹5 Lakh compounds to over ₹31 Lakh in 10 years and ₹77 Lakh in 15 years. Run exact scenarios using our Lumpsum Investment Calculator.
FAQ 5: How should I allocate capital among these 5 Tata stocks?
A balanced wealth allocation is 30% Titan, 25% Trent, 20% Tata Power, 15% Tata Investment, and 10% Tata Tech. This balances large-cap stability with aggressive fast-fashion and EV growth. Calculate exact share counts using our Position Size Calculator.
FAQ 6: What taxes apply when selling Tata shares after holding for 5 years?
Profits held for over 12 months qualify as Long-Term Capital Gains (LTCG). Gains up to ₹1.25 Lakh per financial year are tax-free, while profits above ₹1.25 Lakh are taxed at 12.5%. Calculate your net tax liability with our Stock Market Tax Calculator.
