
Learning how to choose stocks for swing trading is the single most valuable skill an Indian market participant can develop. While day trading glues you to a stressful screen for six hours, and buy-and-hold investing locks your money away for decades, swing trading captures powerful multi-day momentum moves lasting 3 to 15 days. But here is the real deal: out of over 2,000 listed stocks on the NSE and BSE, barely 5 to 10 stocks present high-probability swing opportunities on any given week. In this master trading desk guide, we walk you through our proven 3-step screening system to pinpoint winning swing stocks before the crowd rushes in.
What Is the 3-Step Screener Architecture to Select Swing Stocks?
Most retail traders fail at swing trading because they start with hot tips on Telegram or social media. That is financial suicide. Professional desks follow a strict mechanical screening funnel to filter down the universe systematically.
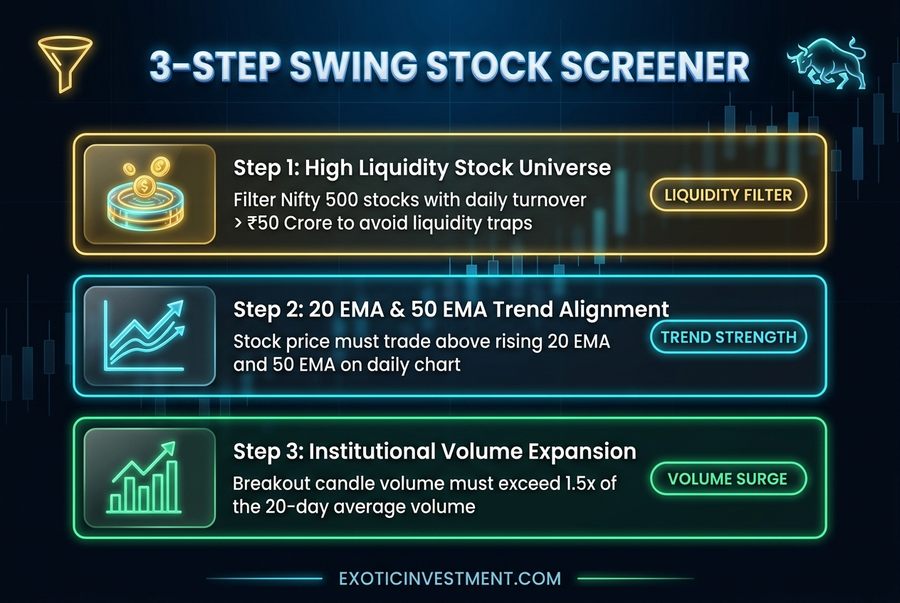
Illustration: The 3-step mechanical screening funnel for Indian swing trading stocks.
Here are the three non-negotiable screening layers:
- Step 1: High Liquidity Stock Universe: Never swing trade illiquid penny stocks. Limit your screening universe strictly to Nifty 500 stocks with a daily trading turnover exceeding ₹50 Crore. High liquidity guarantees tight bid-ask spreads, zero delivery delivery traps, and rapid execution. Check our guide on stock broker apps in India for fast order execution.
- Step 2: Trend Alignment (20 EMA & 50 EMA): The stock must trade above its rising 20-day and 50-day Exponential Moving Averages (EMA). When a stock trades above both moving averages on the daily chart, institutional smart money is actively supporting the trend. Learn how moving averages combine with oscillators in our leading indicators in stock market guide.
- Step 3: Institutional Volume Expansion: Price breakout without volume is a trap. The breakout candle must exhibit volume at least 1.5 times greater than its 20-day average volume. Heavy volume proves institutional desks are absorbing supply.
Before entering any candidate stock, calculate your expected trade gains with our free stock profit calculator.
High-Probability Chart Patterns for Swing Trading Entries
Once your screener produces a focused list of 4 to 6 candidate stocks, you must time your entry using clean price action patterns. Never chase a stock that has already run up 10% in a single day.
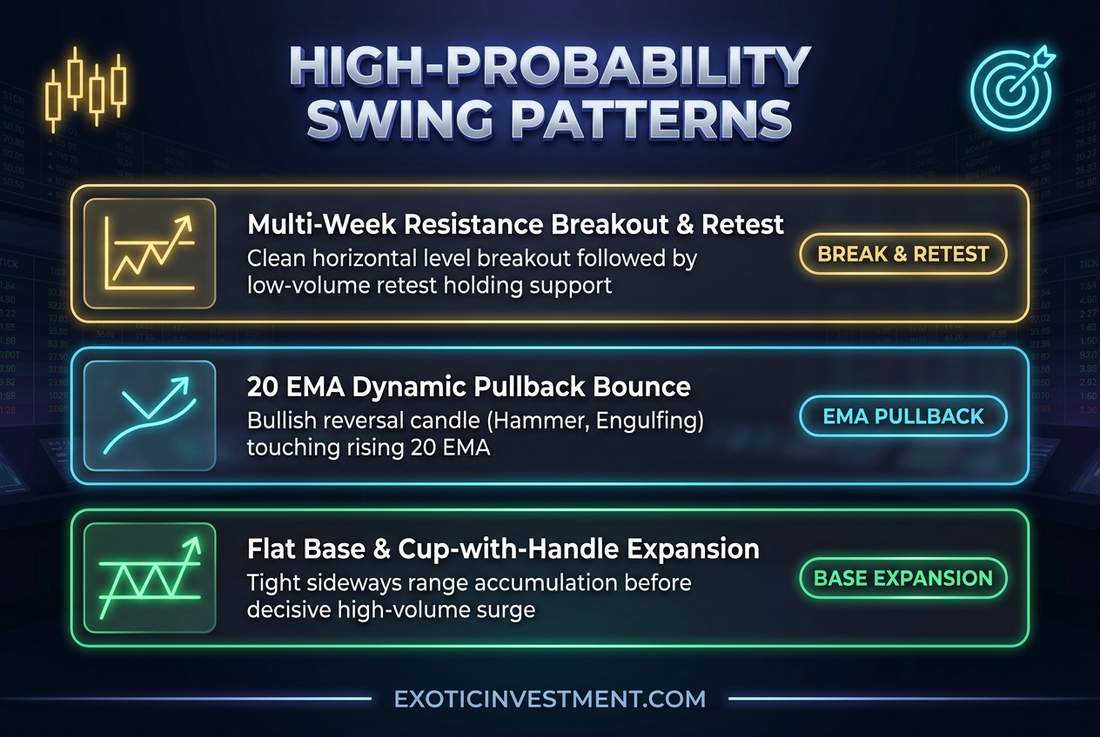
Illustration: High-probability swing setups including breakout-retests and 20 EMA pullback bounces.
Master these three high-probability chart setups:
- Multi-Week Resistance Breakout with Retest: Look for a stock consolidating beneath a clear horizontal resistance ceiling for 3 to 6 weeks. When the stock breaks out on heavy volume, don’t rush in immediately. In Kannada, our elders say: “Nodi thili, maadi kali” (ನೋಡಿ ತಿಳಿ, ಮಾಡಿ ಕಲಿ — observe to understand, practice to master). Wait for the stock to pull back calmly on light volume to retest the broken resistance as new support before entering.
- The 20 EMA Dynamic Pullback Setup: Strong trending stocks rarely pull back to horizontal support levels; they bounce off their rising 20 EMA. When a stock in a clear uptrend touches its 20 EMA and prints a bullish reversal candle (such as a Hammer or Bullish Engulfing), you have a low-risk entry with a tight invalidation point. Review core momentum rules in our dedicated swing trading in India roadmap.
- Tight Volatility Contraction Pattern (VCP): When a stock forms progressively smaller swings with steadily drying volume, it indicates sellers are completely exhausted. A sudden burst of buying volume triggers explosive multi-day expansions.
Risk Management and Position Sizing: Protecting Your Trading Capital
You can pick great stocks all year, but without mathematical risk control, one bad trade will wipe you out. Remember the timeless Kannada truth: “Maathu aadidre hoythu, mutthu odedre hoythu” (ಮಾತು ಆಡಿದರೆ ಹೋಯ್ತು, ಮುತ್ತು ಒಡೆದರೆ ಹೋಯ್ತು — words once spoken cannot be retrieved, a pearl once shattered is lost forever). In the stock market, your trading capital is like a precious pearl. Taking oversized swing positions without a disciplined stop-loss shatters capital like a broken pearl.
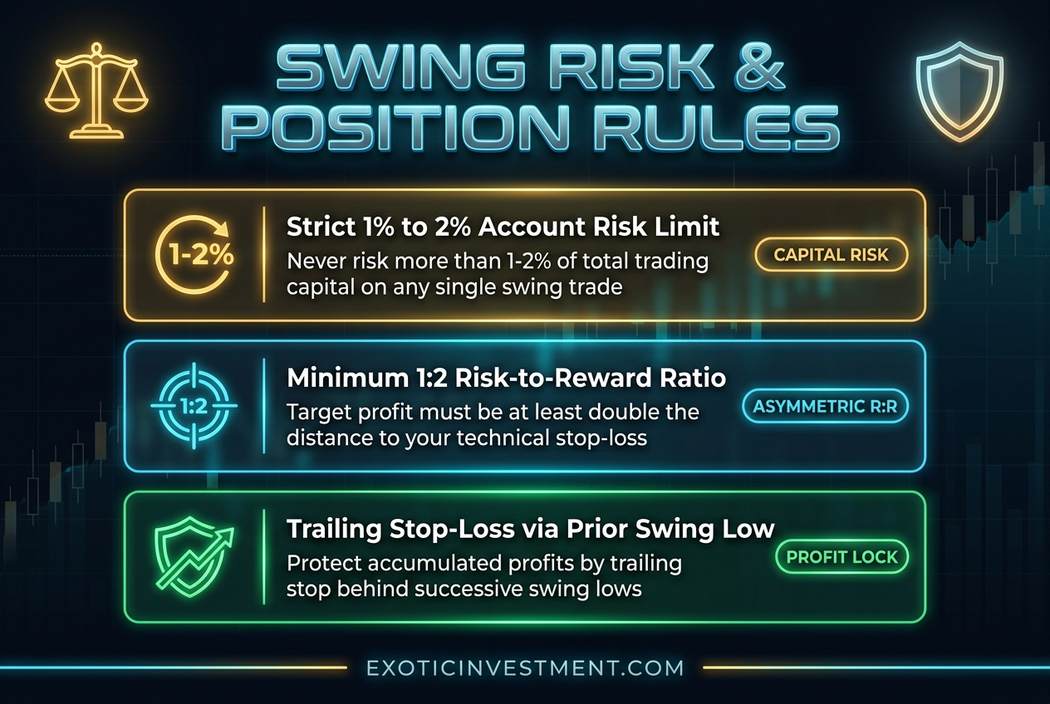
Illustration: Mathematical position sizing and minimum 1:2 asymmetric risk-reward framework.
- The 1% Account Risk Rule: Never risk losing more than 1% to 1.5% of your total trading account on any single trade. If your account size is ₹5 Lakh, your maximum risk on a swing trade is strictly ₹5,000 to ₹7,500. Calculate your exact allowable quantity with our position size calculator before placing your order.
- Minimum 1:2 Asymmetric Risk-to-Reward Ratio: Only take setups where your profit target is at least double your technical stop-loss distance. If your risk is ₹20 per share, your target must be at least ₹40. This allows you to stay highly profitable even with a modest 45% to 50% win rate.
- Trailing Stop-Loss Protection: As the stock moves into profit, trail your stop-loss beneath the most recent swing low on the daily chart. Protect your initial capital, move your stop to breakeven, and let the remaining position capture the meat of the move. In Kannada, remember: “Hani hani koodidre halla” (ಹನಿ ಹನಿ ಕೂಡಿದರೆ ಹಳ್ಳ — small drops make a huge lake). Consistent 4% to 8% swing gains compound into staggering annual wealth.
To project your potential long-term compounding trajectory from disciplined swing trading profits, use our reverse CAGR calculator.
Recommended Trading Courses & Premium Subscriptions:
- Options Buying Course in Kannada: Options Buying Course in Kannada.
- Technical Analysis in Kannada Course: Technical Analysis in Kannada Course.
- Kaliyiri Share Market Book: Kaliyiri Share Market Book.
- Basics of Stock Market Course: Basics of Stock Market Course.
- MultiBagger Plus Courses & Pro Tools Annual Subscription (Plan 5268): MultiBagger Plus Courses & Pro Tools Annual Subscription.
💡 Frequently Asked Questions (FAQ)
1. What is the ideal holding period for a swing trading stock in India?
The standard holding period for swing trading ranges between 3 to 15 trading sessions. The goal is to capture a distinct price swing from support to resistance. If a stock fails to move after 7 to 10 days, capital is often better reallocated. Check delivery brokerage charges for holding shares with our Zerodha brokerage calculator.
2. Should swing traders hold stocks through quarterly earnings announcements?
No. Holding swing positions through quarterly earnings results turns trading into a coin-toss gamble. Even great earnings can trigger institutional profit-booking dumps. Learn why this happens in our guide on 7 stock market secrets big institutions use.
3. Which timeframe is best for screening and executing swing trades?
The Daily chart is the primary anchor for swing trading. Use the Daily chart to identify trend alignment and support/resistance levels. You can drop down to the 1-hour or 15-minute chart to fine-tune your entry timing, but never fight the daily trend.
4. How many stocks should a swing trader hold at one time?
A retail swing trader should typically hold between 3 to 5 non-correlated stocks simultaneously. Holding 15 or 20 stocks dilutes focus and turns your account into an unmanageable mutual fund. Always calculate position limits with our position size calculator.
5. How can traders access institutional-grade stock screeners and research?
You can build custom breakout scanners on TradingView or access our pre-filtered institutional research, watchlists, and tools through the MultiBagger Plus Courses & Pro Tools Annual Subscription.
